London Travel Statistics (2026 Data)
How many tourists visit London, where they come from, what they spend, how long they stay, when the city is busiest, and how visitors arrive, get around and keep London's hotels and attractions busy.
- Published
- Updated
- 20 sources
- 171 statistics
- 15 min read
Licence: CC BY 4.0. Free to reuse the text, charts and data with credit to London Tourist Map and a link to this page.


- Former federal consular-fee policy analyst
- Credentialed actuary
- 18 years in travel-insurance underwriting
Key findings
- 19.3 millionLondon received 19.3 million international visits in 2025, and visitors spent £15.8 billion ($20.9 billion).
- 52%Over half, 52%, of all international visits to Great Britain in 2025 included a stay in London.
- 3.7 millionVisitors from the United States made 3.7 million visits to London in 2025, 19.0% of the total.
- £820An international visitor stayed 5.5 nights and spent £820 ($1,081) per visit to London in 2025.
- 188.6 millionBritish residents made 188.6 million day visits and 15.1 million overnight trips to London in 2024.
- 7.1 millionThe Natural History Museum drew 7.1 million visits in 2025, more than any other London attraction.
- 179.2 millionLondon's six airports handled 179.2 million passengers in 2025, 99.0% of the 2019 total.
- 76,000Hotels and similar accommodation employed 76,000 people in London in 2024.
Add up every kind of trip and London had about 224 million1 visits in 2024: 188.6 million2 day visits by British residents, 15.1 million3 overnight trips from elsewhere in Britain and 20.7 million4 visits from abroad. The international visitors matter most to the city's tills. In 2025 they made 19.3 million5 visits, stayed 107.0 million6 nights and spent £15.8 billion5 ($20.9 billion1) in London, more than half of everything overseas visitors spent in the whole of the UK.
The numbers below answer the questions most people ask about travel to London: how many visitors come and from where, what they spend, how long they stay and why, when the city is busiest, and how they arrive and get around. Along the way: one country sends almost a fifth of all international visitors, a free museum in South Kensington became the UK's most visited attraction among those that report their figures,7 and one borough holds almost two in five of London's hotel jobs. The first table gathers the headline figures.
| International visits | 19.3 million | 2025 |
| Nights spent by international visitors | 107.0 million | 2025 |
| International visitor spending in London | £15.8 billion ($20.9 billion) | 2025 |
| Share of Great Britain's international visits that included London | 52% | 2025 |
| Domestic overnight trips | 15.1 million | 2024 |
| Domestic day visits | 188.6 million | 2024 |
| Passengers at London's six airports | 179.2 million | 2025 |
| Underground journeys | 1,204.2 million | 2025-26 (April-March) |
| Most visited attraction: Natural History Museum | 7.1 million visits | 2025 |
| Jobs in hotels and similar accommodation | 76,000 | 2024 |
How many tourists visit London each year?
International visitors
London received 19.3 million5 international visits in 2025. A visit counts once however many nights it lasts, and it counts for London if the visitor slept at least one night in the city, so the number is visits, not individual people: someone who comes three times a year is counted three times.5
The long-run picture is growth with one deep hole. Visits rose from 11.6 million12 in 2002 to a record 21.7 million12 in 2017 and again in 2019, collapsed to 2.7 million12 in 2021 when borders reopened only partly, and recovered to 20.3 million12 in 2023 and 20.7 million4 in 2024. No figure exists for 2020, when interviewing stopped for most of the year. The 2025 figure is not directly comparable with 2019: the count changed its method in July 2024, so part of the gap between 21.7 million12 and 19.3 million5 may be the new method rather than fewer visitors.
Comparing like with like, the second half of 2025 was 1%5 busier than the second half of 2024.
Projection: linear trend of 2002–2025 yearly values, 95% prediction range. Our calculation, not a forecast.
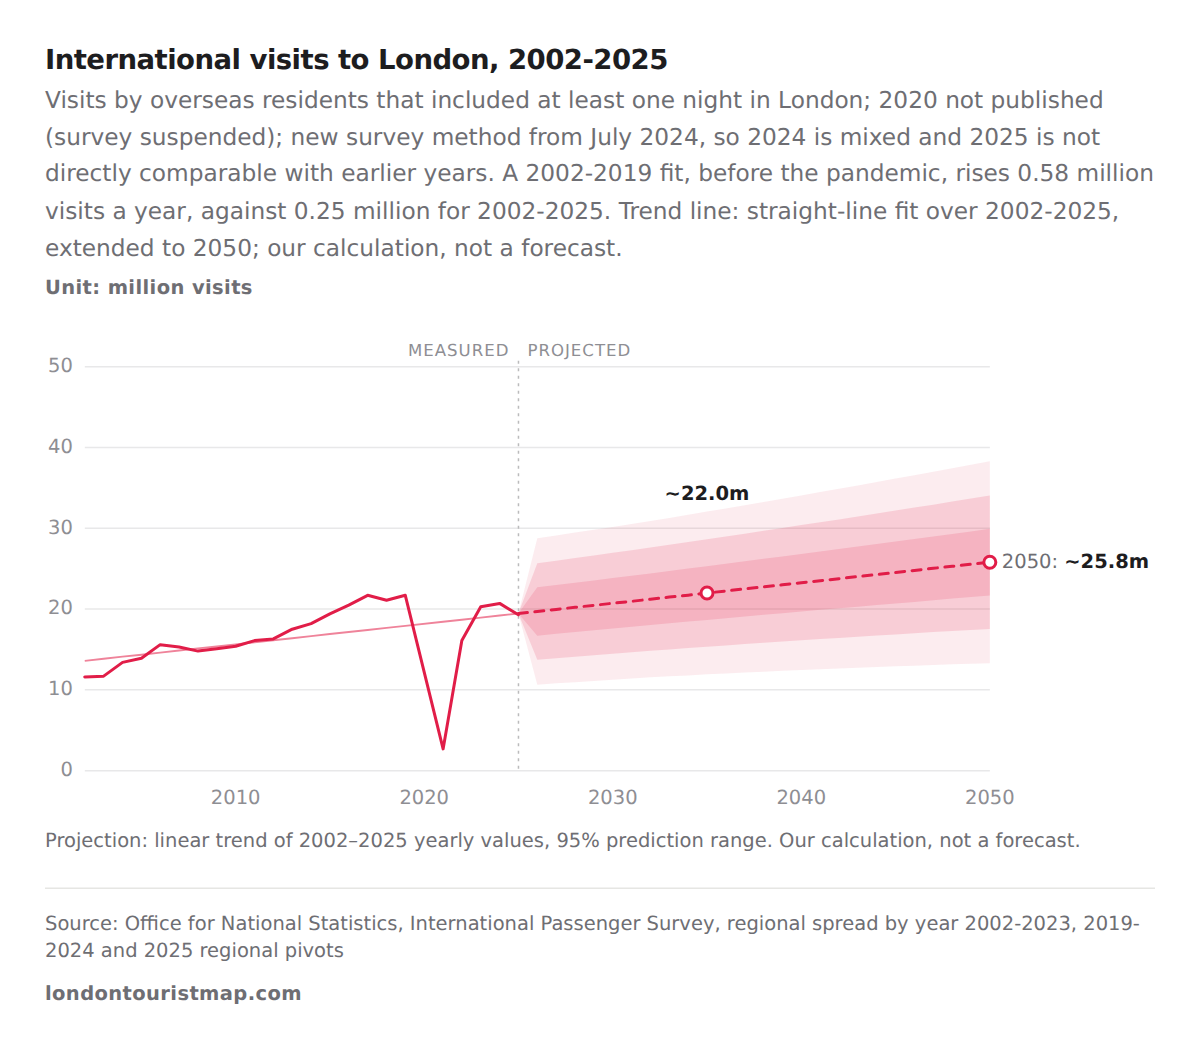
- Visits reached 21.7 million in both 2017 and 2019, the highest years.
- The 2021 low was 2.7 million.
- 2025 had 19.3 million visits, 7.7 million more than 2002's 11.6 million.
The trend line runs through the pandemic years and the method change, so treat it as a rough guide only; fitted on 2002-2019 alone, before both, it would rise faster. The official outlook covers only the UK as a whole and is discussed below; no separate forecast for London is published.
Visits are only half of the story; nights and money matter as much. International visitors spent 118.4 million12 nights in London in 2019 and 107.0 million6 in 2025, while their spending rose from £5.8 billion12 in 2002 to £17.0 billion4 in 2024 ($21.7 billion1) in current pounds, before £15.8 billion5 in 2025. The table converts each year's spending into dollars at that year's average exchange rate.
| 2002 | 75.4m | £5,788m | $8,702m |
| 2003 | 78.9m | £5,870m | $9,599m |
| 2004 | 90.2m | £6,439m | $11,799m |
| 2005 | 91.8m | £6,859m | $12,475m |
| 2006 | 101.1m | £7,822m | $14,415m |
| 2007 | 95.8m | £8,192m | $16,403m |
| 2008 | 90.8m | £8,126m | $15,055m |
| 2009 | 91.8m | £8,910m | $13,958m |
| 2010 | 96.4m | £9,507m | $14,698m |
| 2011 | 97.9m | £10,089m | $16,173m |
| 2012 | 101.7m | £10,941m | $17,343m |
| 2013 | 103.1m | £12,074m | $18,888m |
| 2014 | 114.6m | £12,737m | $20,987m |
| 2015 | 115.2m | £13,131m | $20,072m |
| 2016 | 123.1m | £13,815m | $18,709m |
| 2017 | 130.5m | £16,267m | $20,965m |
| 2018 | 123.8m | £14,863m | $19,842m |
| 2019 | 118.4m | £15,700m | $20,043m |
| 2021 | 31.2m | £2,689m | $3,699m |
| 2022 | 104.3m | £14,149m | $17,490m |
| 2023 | 115.8m | £16,697m | $20,761m |
| 2024 | 115.8m | £16,955m | $21,674m |
| 2025 | 107.0m | £15,824m | $20,864m |
London's share of Britain's international visitors
Most overseas visitors to Britain spend at least one night in the capital. In 2025, 52%5 of all international visits to Great Britain included London, against 13.6 million5 visits to the rest of England combined.5 The longer series, for the UK, shows how steady this pull has been: London's share of visits that included a night anywhere in the UK moved between 48.9%12 and 55.1%12 from 2002 to 2019, dipped to 43.2%12 in 2021 and reached 55.2%4 in 2024, the highest in the series. The 2025 figure of 52% is measured against all visits to Great Britain, a different base, so it is not a fall from 2024.
Projection: linear trend of 2002–2024 yearly values, 95% prediction range. Our calculation, not a forecast.
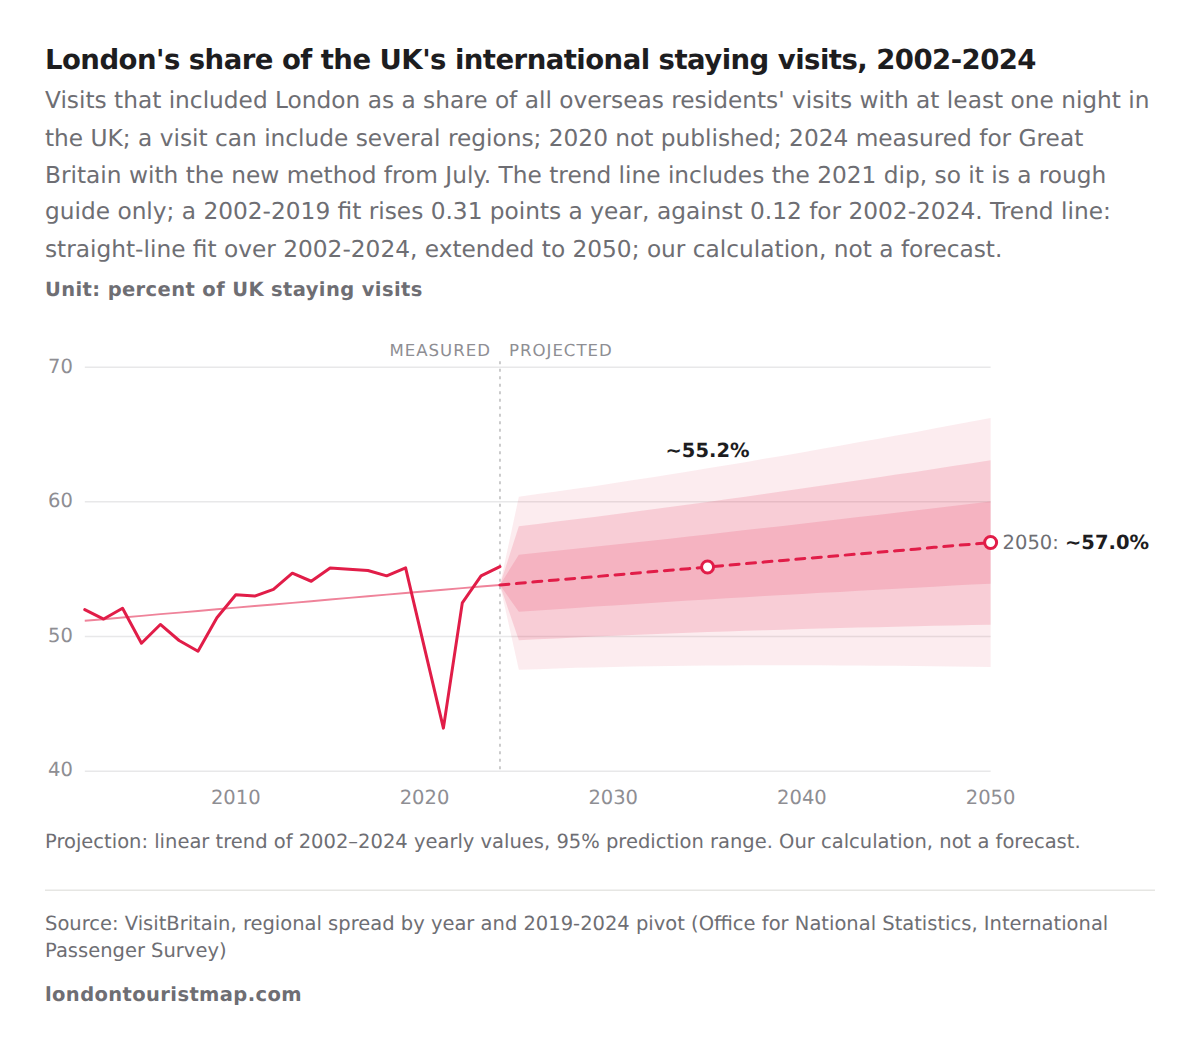
- The share was 52.0% in 2002 and 55.2% in 2024.
- It dipped to 43.2% in 2021.
- Before 2024 the high point was 55.1%, in 2015 and 2019.
Against Britain's other nations and regions the gap is wide. London's 19.3 million5 visits in 2025 were almost five times the 3.9 million5 of the South East, the next English region,1 and the £15.8 billion5 spent in London was four times the £3.9 billion5 spent in Scotland.
| London | 19,292k | £15,824m |
| Rest of England | 13,589k | £8,489m |
| Scotland | 4,175k | £3,920m |
| South East | 3,911k | £2,303m |
| North West | 3,076k | £1,446m |
| East of England | 2,123k | £1,073m |
| South West | 2,014k | £1,299m |
| West Midlands | 1,609k | £858m |
| Yorkshire | 1,142k | £644m |
| Wales | 913k | £510m |
| East Midlands | 905k | £546m |
| North East | 503k | £313m |
| Total UK | 40,787k | £29,808m |
Where do London's international visitors come from?
The United States is London's biggest market by a long way.6 Americans made 3.7 million6 visits in 2025, 19.0%1 of the total and more than twice as many as France, the second market, with 1.8 million6.6 Germany, Spain and Italy follow, and the top five countries together account for 48.3%1 of all visits. Long-haul markets beyond the US are smaller but stay longer: Australia sent 795,0006 visits and India 244,0006.
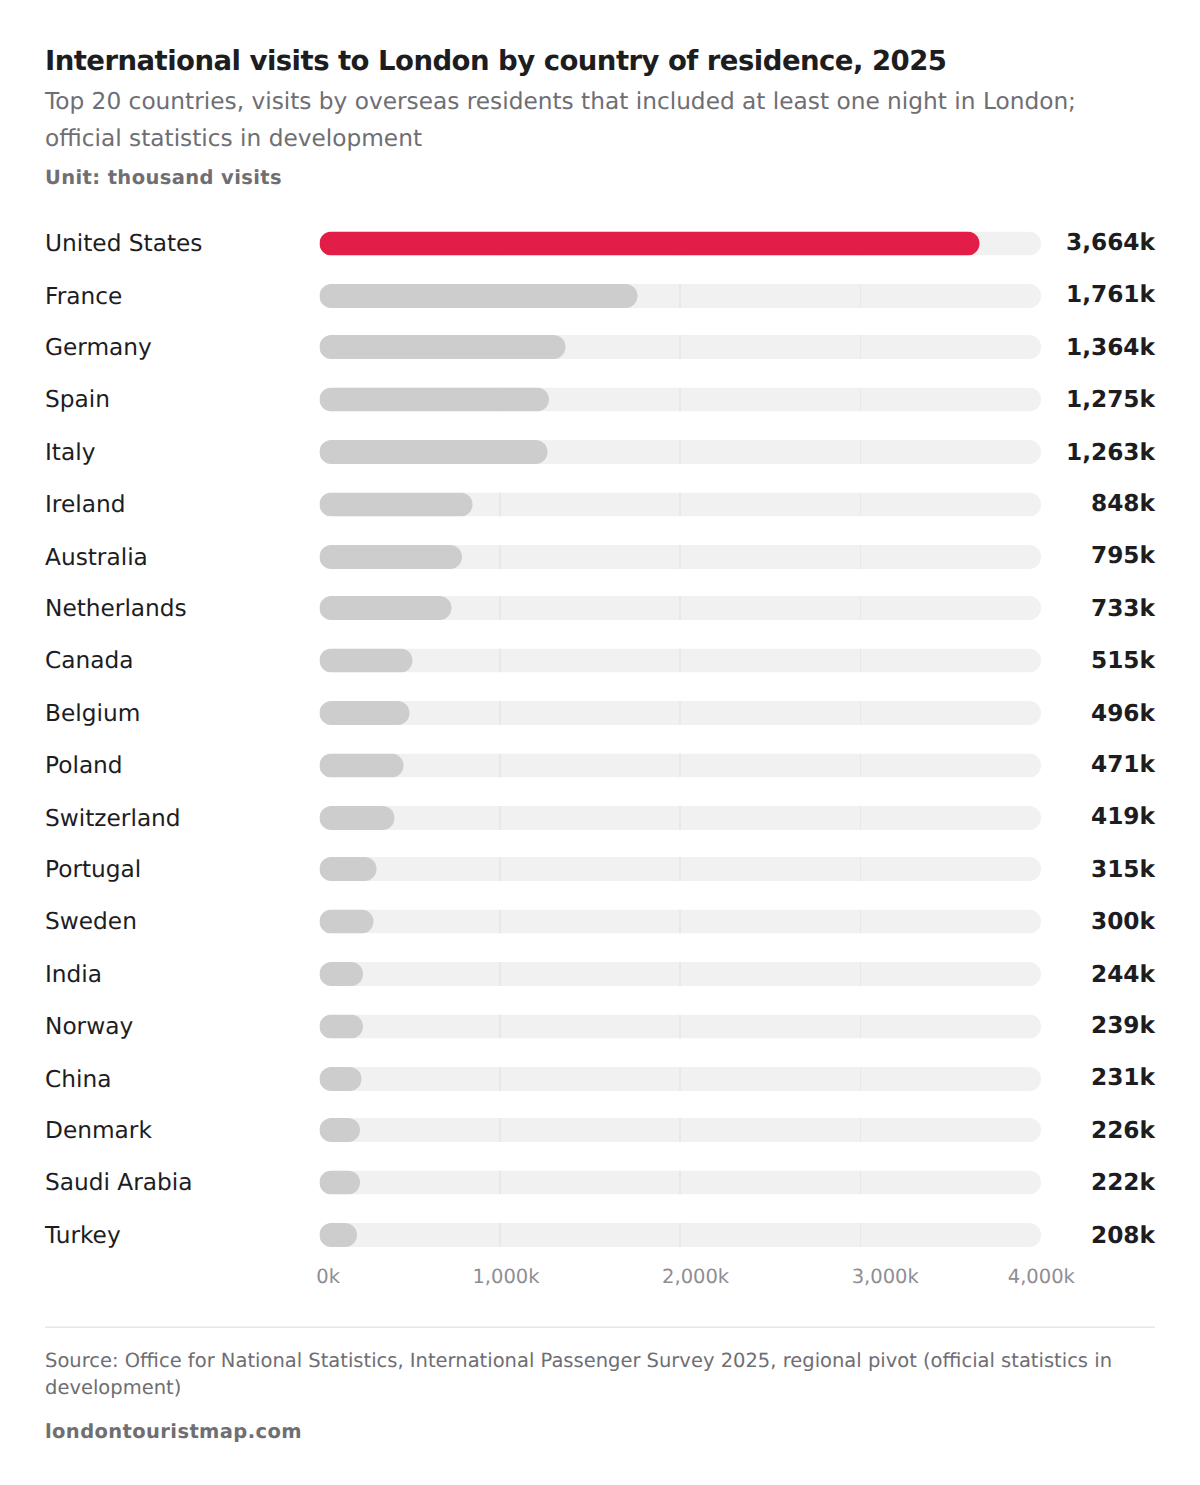
- The United States led with 3,664 thousand visits.
- France was second with 1,761 thousand.
- Germany, Spain and Italy each made between 1,263 and 1,364 thousand visits.
So who stays longest, and who spends most per visit? European markets average about three to five nights per visit; visitors from further away stay longer and spend more each time. An American visit lasted 5.4 nights6 and brought £1,1916 ($1,5701) of spending in London; a French one 4.0 nights6 and £5306. Visitors from India stayed 17.1 nights6, and visitors from Saudi Arabia and the UAE spent the most per visit in the table, £2,5886 and £2,5476, though these estimates rest on a few hundred interviews each.
Every row rests on at least 188 interviews; the Gulf and China rows are the least precise.
| United States | 5.4 | £1,191 | $1,570 | 5,637 |
| France | 4.0 | £530 | $699 | 2,789 |
| Germany | 4.1 | £575 | $758 | 1,951 |
| Spain | 5.1 | £520 | $686 | 1,300 |
| Italy | 4.5 | £475 | $626 | 1,182 |
| Ireland | 3.1 | £421 | $555 | 1,260 |
| Australia | 6.9 | £933 | $1,230 | 971 |
| Netherlands | 3.4 | £607 | $800 | 1,065 |
| Canada | 5.6 | £837 | $1,104 | 691 |
| Belgium | 3.1 | £510 | $672 | 904 |
| Poland | 4.5 | £454 | $599 | 396 |
| Switzerland | 3.7 | £633 | $835 | 588 |
| Portugal | 5.3 | £438 | $578 | 346 |
| Sweden | 3.7 | £511 | $674 | 402 |
| India | 17.1 | £914 | $1,205 | 324 |
| Norway | 3.5 | £761 | $1,003 | 346 |
| China | 10.1 | £1,296 | $1,709 | 194 |
| Denmark | 3.5 | £597 | $787 | 329 |
| Saudi Arabia | 8.7 | £2,588 | $3,412 | 264 |
| Turkey | 7.8 | £952 | $1,255 | 231 |
| Brazil | 7.5 | £1,101 | $1,452 | 290 |
| UAE | 8.1 | £2,547 | $3,358 | 188 |
The market mix has shifted since before the pandemic, though the method change again calls for care. US visits were 3.1 million4 in 2019 and 3.7 million4 in 2024, while Portugal, Sweden, India, Belgium and Italy sent clearly fewer visitors in 2024 than in 2019, and Germany about the same. The table compares the two years for 2025's top 15 countries, both measured before or across the switch to the new survey.
| United States | 3,088k | 3,690k | 19.5% |
| France | 1,838k | 2,002k | 8.9% |
| Germany | 1,508k | 1,495k | −0.8% |
| Spain | 1,212k | 1,446k | 19.3% |
| Italy | 1,392k | 1,232k | −11.5% |
| Ireland | 748k | 771k | 3.0% |
| Australia | 569k | 677k | 19.1% |
| Netherlands | 712k | 797k | 11.9% |
| Canada | 499k | 554k | 11.0% |
| Belgium | 520k | 412k | −20.6% |
| Poland | 517k | 552k | 6.8% |
| Switzerland | 486k | 493k | 1.4% |
| Portugal | 354k | 265k | −25.0% |
| Sweden | 458k | 320k | −30.1% |
| India | 445k | 350k | −21.3% |
How much do visitors spend in London?
International visitors spent £15.8 billion5 ($20.9 billion1) in London in 2025, or £8206 ($1,0811) per visit and £1486 ($1951) per night. Americans alone spent £4.4 billion6, 27.6%1 of the total, because they are both the largest group and among the highest spenders per visit. The figure is the part of each visitor's trip spending attributed to London, from rooms and meals to shopping and transport, not the flight to get here; spending elsewhere in Britain on the same trip is counted for those places.
- United States£4,363m27.6%
- France£933m5.9%
- Germany£784m5%
- Australia£742m4.7%
- Other countries£9,002m56.9%
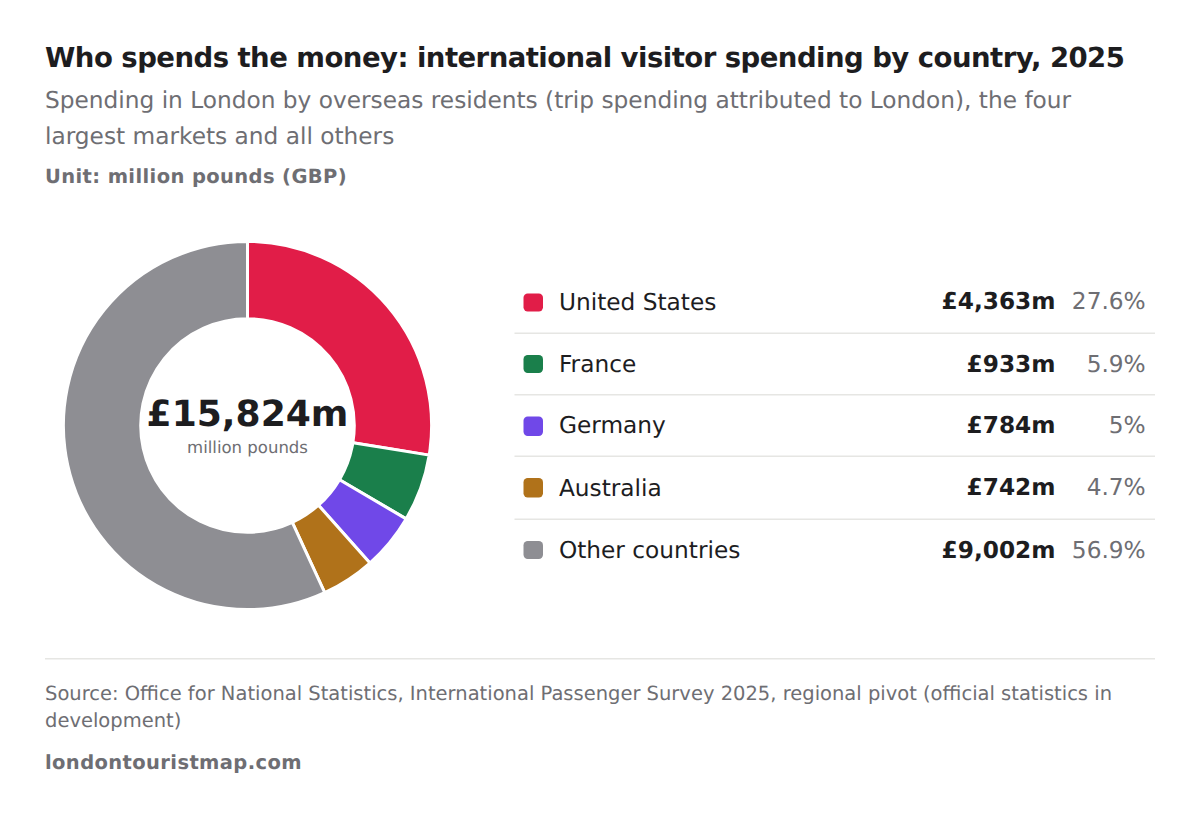
- The United States accounted for £4,363 million.
- France was second with £933 million.
- All other countries together spent £9,002 million.
Per trip, spending has risen in pounds. A visit cost £49912 in 2002 and £8194 in 2024; a night cost £7712 and £1464. The 2021 spike to £98912 per visit reflects the few, long trips of that year, 11.5 nights12 on average. These are current pounds, not adjusted for inflation.
- Per visit
- Per night
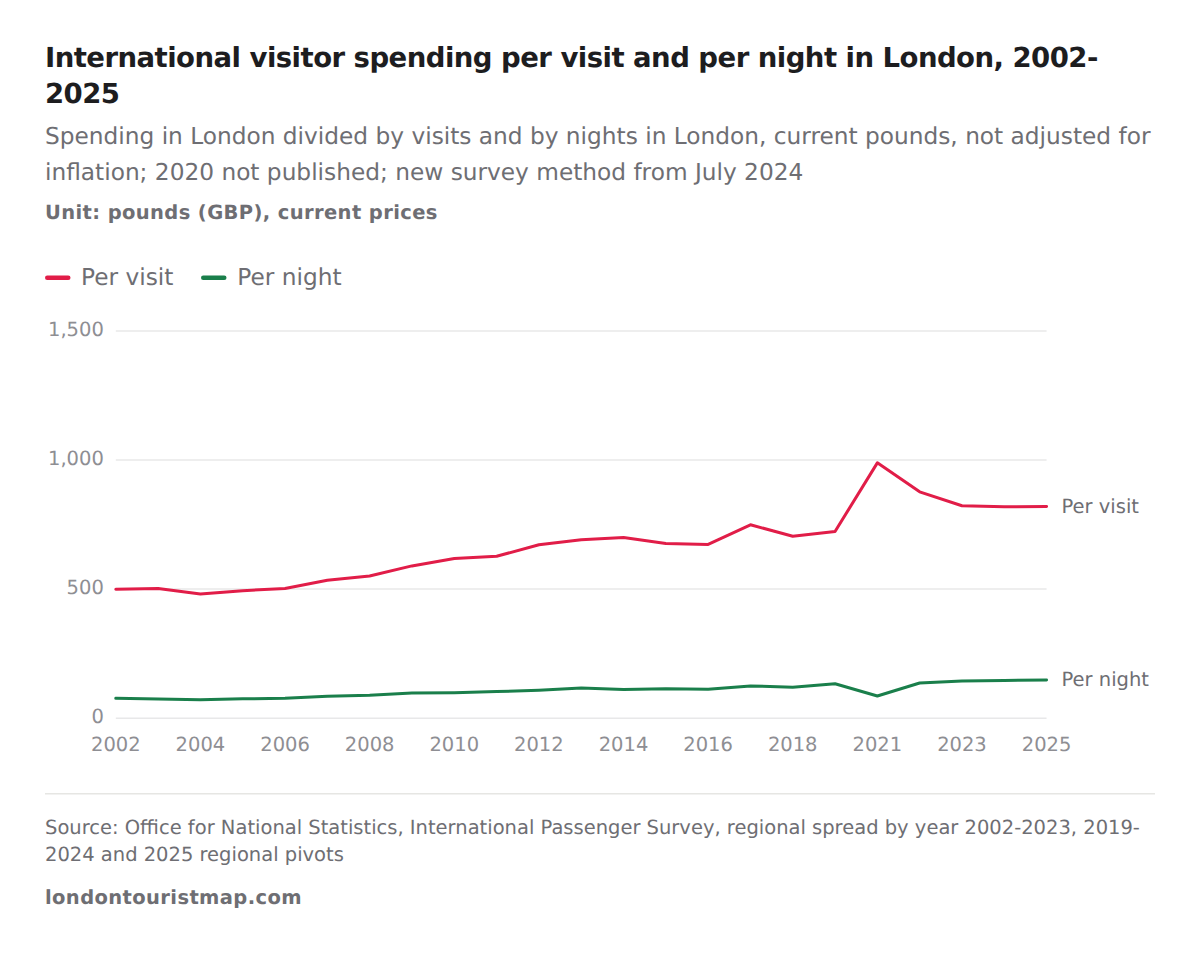
- Spending per visit rose from £499 in 2002 to £820 in 2025.
- Spending per night rose from £77 to £148.
- 2021 peaked at £989 per visit but only £86 per night.
A note on pounds and dollars
Every dollar figure on this page uses the average exchange rate of the same year, so a year's spending is never converted at today's rate. The pound bought $2.002211 on average in 2007 and $1.236211 in 2022; in 2025 it averaged $1.318511. A weaker pound makes London cheaper for American visitors even when prices in pounds stay the same.
| 2002 | $1.5035 |
| 2003 | $1.6353 |
| 2004 | $1.8323 |
| 2005 | $1.8189 |
| 2006 | $1.8430 |
| 2007 | $2.0022 |
| 2008 | $1.8528 |
| 2009 | $1.5665 |
| 2010 | $1.5460 |
| 2011 | $1.6030 |
| 2012 | $1.5851 |
| 2013 | $1.5644 |
| 2014 | $1.6477 |
| 2015 | $1.5286 |
| 2016 | $1.3542 |
| 2017 | $1.2888 |
| 2018 | $1.3350 |
| 2019 | $1.2766 |
| 2020 | $1.2837 |
| 2021 | $1.3757 |
| 2022 | $1.2362 |
| 2023 | $1.2434 |
| 2024 | $1.2783 |
| 2025 | $1.3185 |
Why do people visit London, and how long do they stay?
Most international visitors come on holiday. Holidays made 10.5 million6 of 2025's visits, 54.2%1, followed by visits to friends or relatives, 5.0 million6, and business trips, 2.8 million6. Study and other reasons made up the rest.6
- Holiday10,463k54.2%
- Visiting friends or relatives4,987k25.9%
- Business2,795k14.5%
- Other (study and other reasons)1,047k5.4%
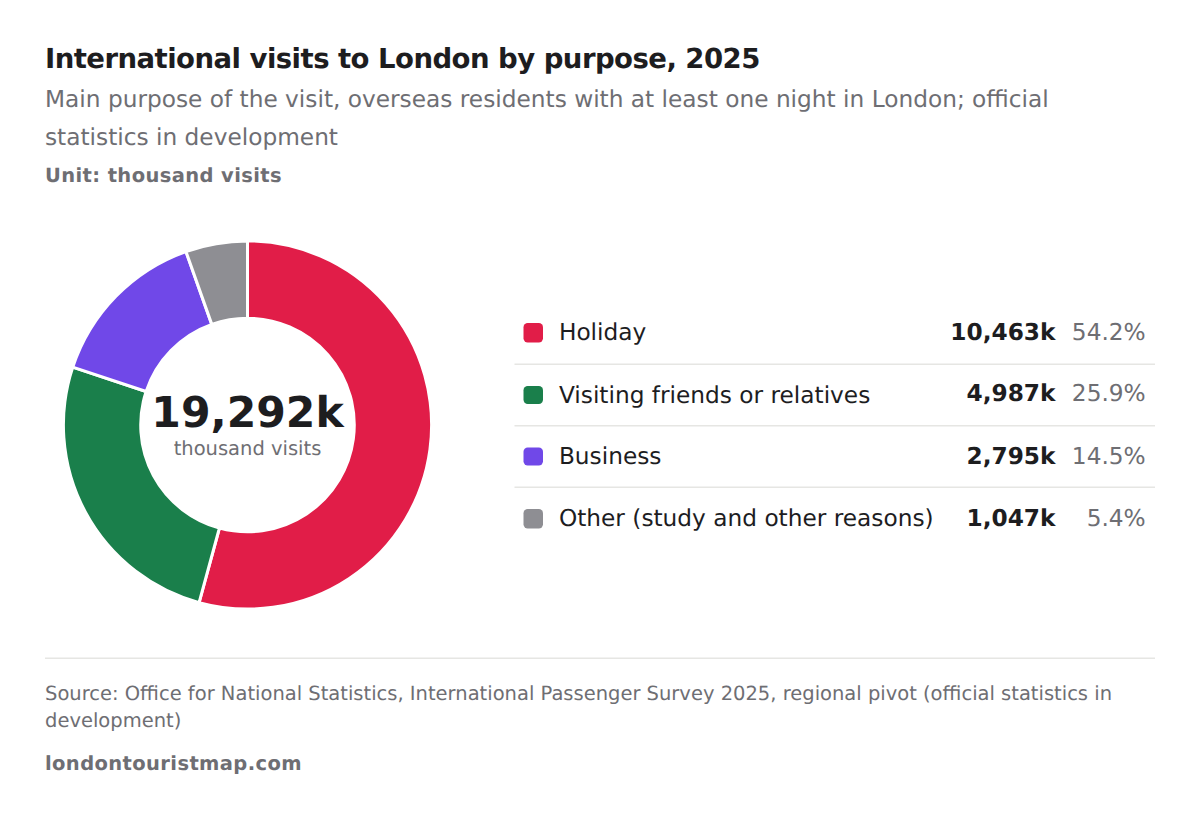
- Holidays made 10,463 thousand visits.
- Business trips made 2,795 thousand visits.
- Visits to friends or relatives made 4,987 thousand.
The purpose shapes the stay. Holidaymakers stayed 4.4 nights6 on average and spent £1916 a night; people visiting friends or relatives stayed 7.9 nights6 but spent only £706 a night. Business visitors spent the most per night, £2636, and students the most per visit, £1,8066, over stays of 22.9 nights6.
| Holiday | 45,836k | 4.4 | £8,745m | £836 | £191 |
| Visiting friends or relatives | 39,154k | 7.9 | £2,755m | £552 | £70 |
| Business | 12,228k | 4.4 | £3,214m | £1,150 | £263 |
| Study | 6,782k | 22.9 | £535m | £1,806 | £79 |
| Other | 2,954k | 3.9 | £576m | £766 | £195 |
Over the long run, holidays drove the growth. Holiday visits more than doubled from 4.9 million13 in 2002 to 11.1 million13 in 2019, while business visits rose only from 2.8 million13 to 4.0 million13. Business travel has not come back in the same way since: 2025's 2.8 million6 business visits were 30%1 fewer than in 2019, though the counting method changed in 2024, so the exact size of the drop is uncertain.
- Holiday
- Visiting friends or relatives
- Business
- Study and other
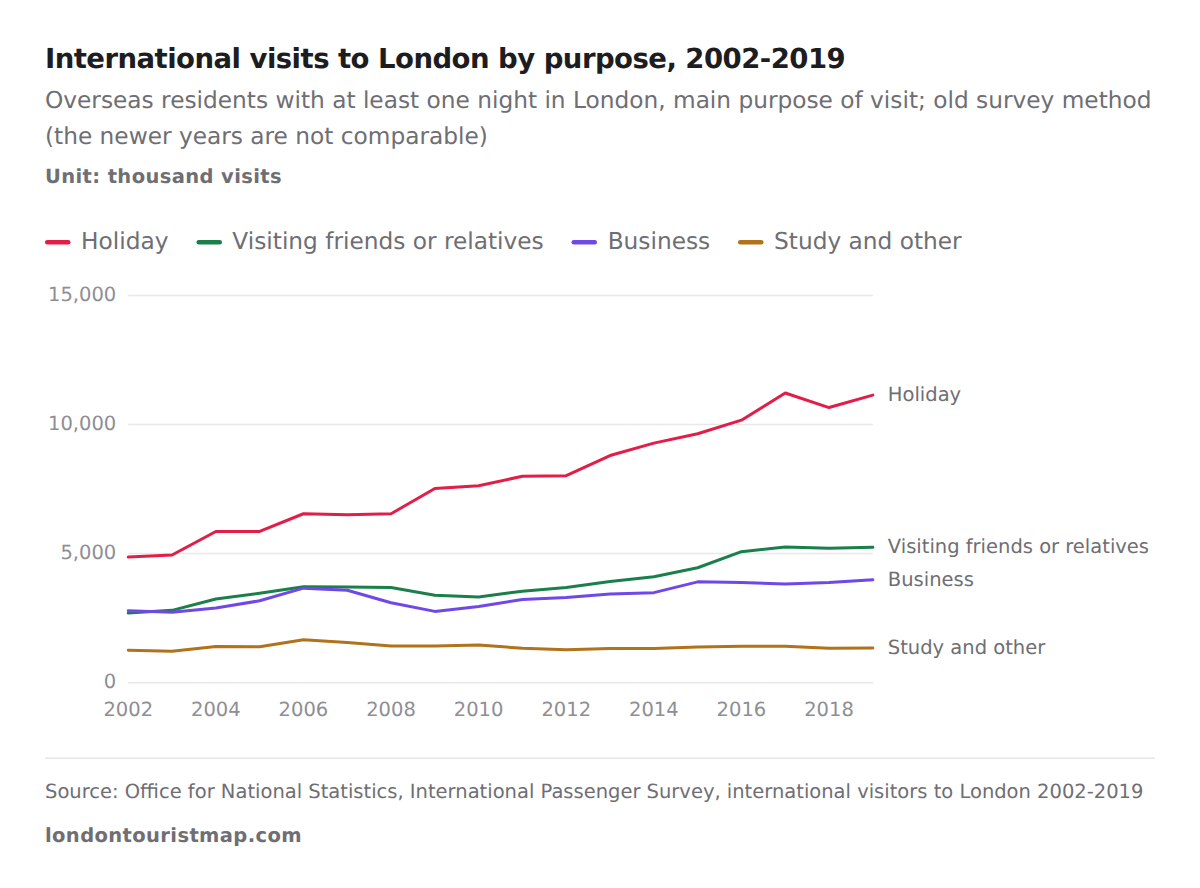
- Holiday visits rose from 4,863 thousand in 2002 to 11,142 thousand in 2019.
- Visits to friends or relatives nearly doubled, from 2,696 thousand to 5,242 thousand.
- Business visits peaked at 3,984 thousand in 2019.
How long do visitors stay?
The average international visit lasted 5.5 nights1 in 2025. On the old survey method it fell from 6.512 nights in 2002 to 5.512 in 2019 as long trips shrank: counting the whole UK stay, visits of 8 nights or more were 23.8%1 of the total in 2002 and 19.3%1 in 2019, while trips of one to three nights held steady at about 46%1. Before the pandemic, almost half of all visits were short: in 2019, 9.8 million13 of the 21.7 million12 visits lasted one to three nights, and only 1.4 million13 lasted 15 nights or more. The newer survey does not yet publish this breakdown for London.
- 1-3 nights9,848k45.4%
- 4-7 nights7,674k35.3%
- 8-14 nights2,807k12.9%
- 15 nights or more1,385k6.4%
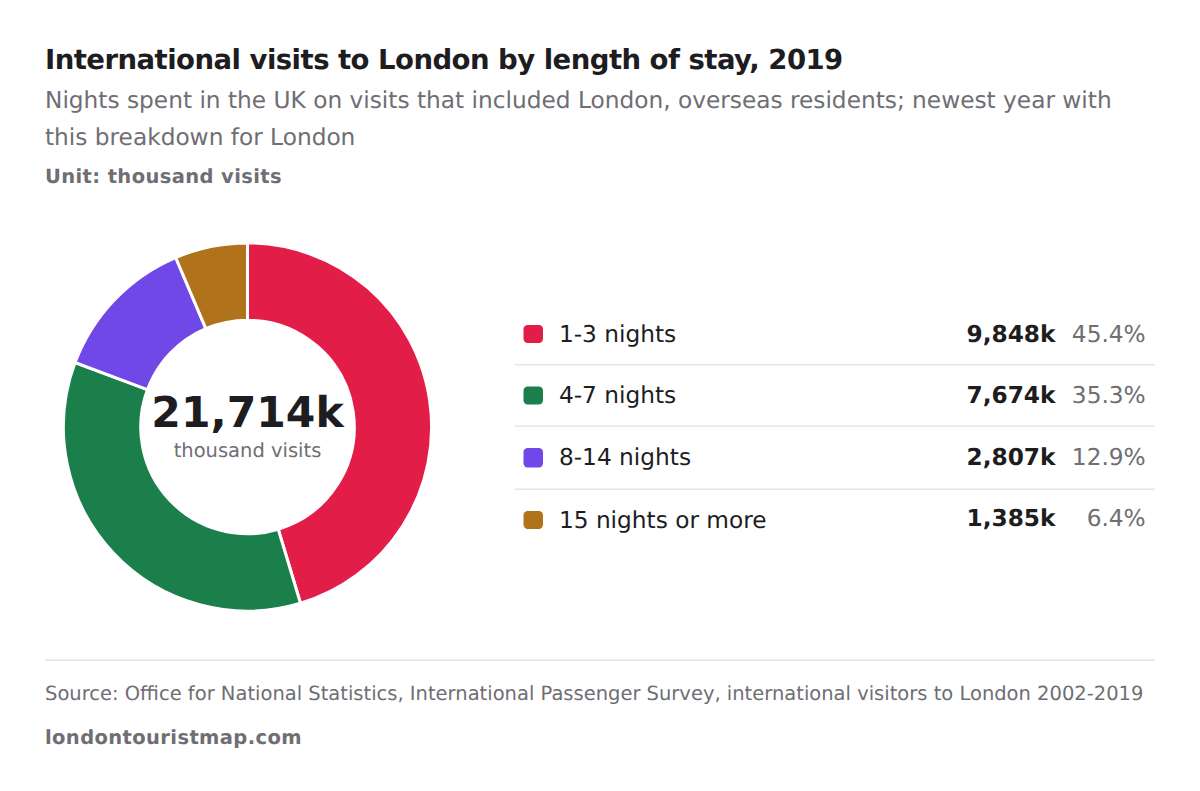
- Stays of 1-3 nights made 9,848 thousand visits.
- Stays of 4-7 nights made 7,674 thousand.
- Only 1,385 thousand visits lasted 15 nights or more.
When is London busiest?
Summer. July to September is the peak quarter, with 5.4 million5 international visits in 2025, and January to March is the quietest, with 4.0 million5. The busiest quarter had 1.351 times the visits of the quietest. October to December runs close to spring, and the same shape held before the pandemic, both in 2019 and on average over 2010-2019.
- 2025
- 2019
- Average 2010-2019
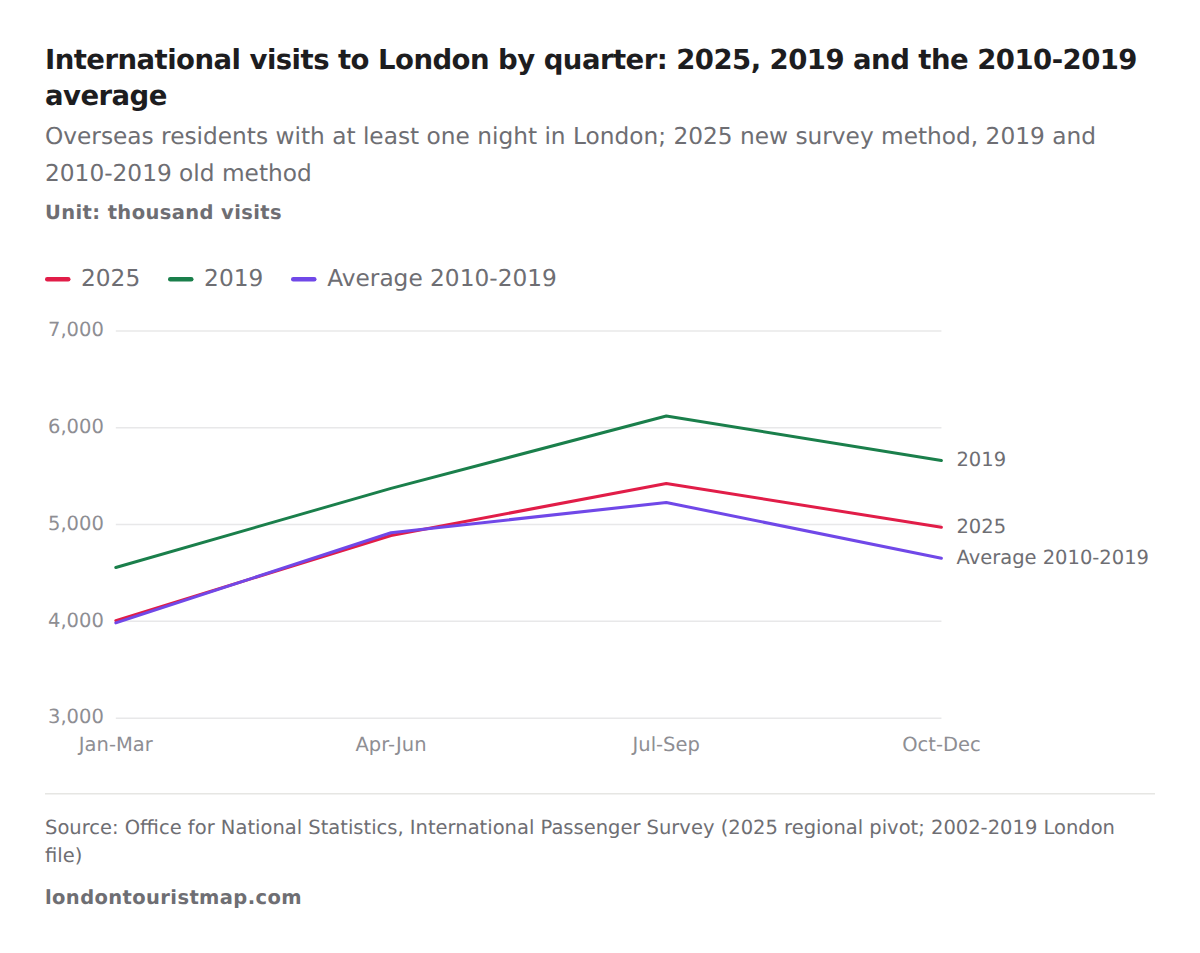
- July-September 2025 had 5,424 thousand visits, the most of any quarter.
- January-March 2025 had 4,008 thousand.
- In 2019 the summer quarter reached 6,122 thousand.
Total spending peaks with the visitors: £4.9 billion6 in July to September 2025. Spending per night, though, is highest in October to December, £1626, against £1306 in January to March.
| January-March | 21,643k | £2,809m | £701 | £130 |
| April-June | 26,299k | £4,018m | £822 | £153 |
| July-September | 33,502k | £4,866m | £897 | £145 |
| October-December | 25,510k | £4,132m | £831 | £162 |
How do visitors get to London?
Mostly by air. In 2019, the newest year with this split for London, 18.0 million13 of the 21.7 million12 international visits travelled by air, 2.7 million13 used the Channel Tunnel and 1.1 million13 came by sea.13
- Air17,951k82.7%
- Channel Tunnel2,711k12.5%
- Sea1,051k4.8%
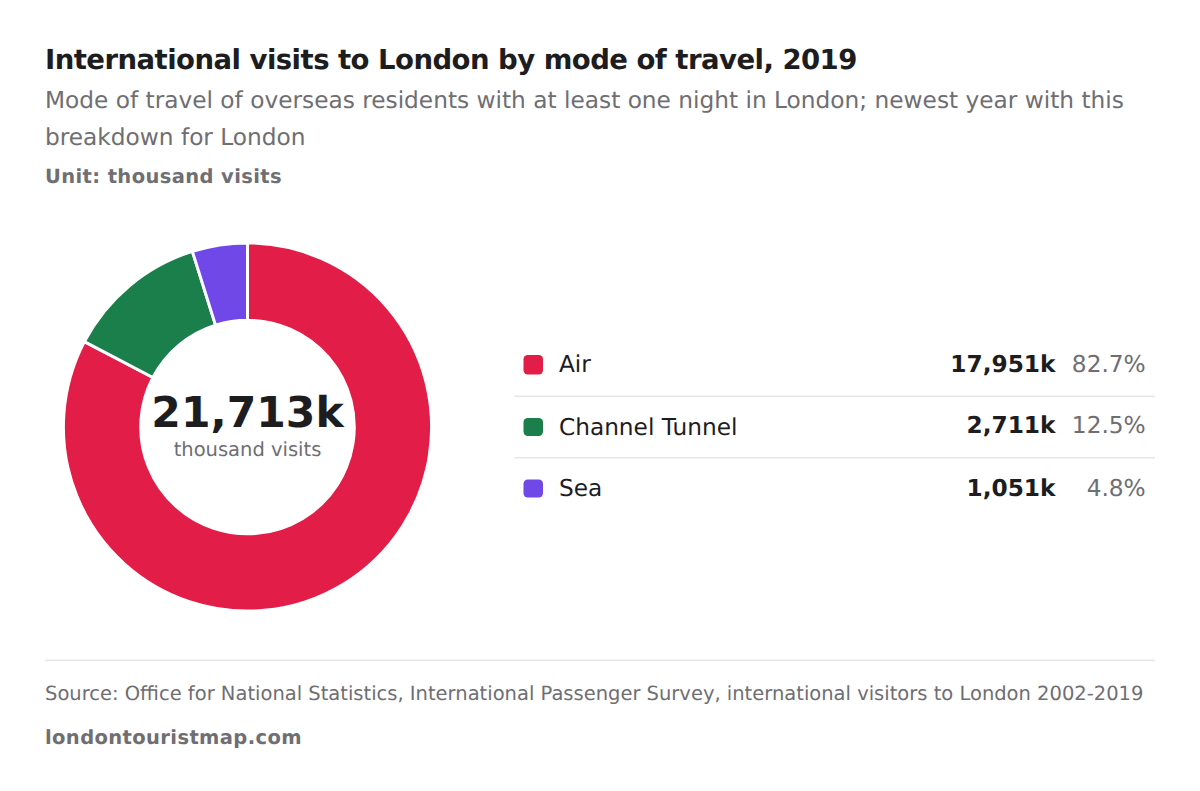
- Air carried 17,951 thousand visits.
- The Channel Tunnel carried 2,711 thousand.
- Sea crossings carried 1,051 thousand.
London's six airports handled 179.2 million8 passengers in 2025, counting arrivals and departures of travellers of every nationality, residents included. Heathrow alone handled 84.5 million8, 47.1%1 of the London total and the highest figure in its 2015-2025 record.8 Gatwick handled 42.8 million8, Stansted 29.8 million8, Luton 17.8 million8 and London City 3.7 million8. Together the six airports carried 59.9%1 of all passengers at UK airports.
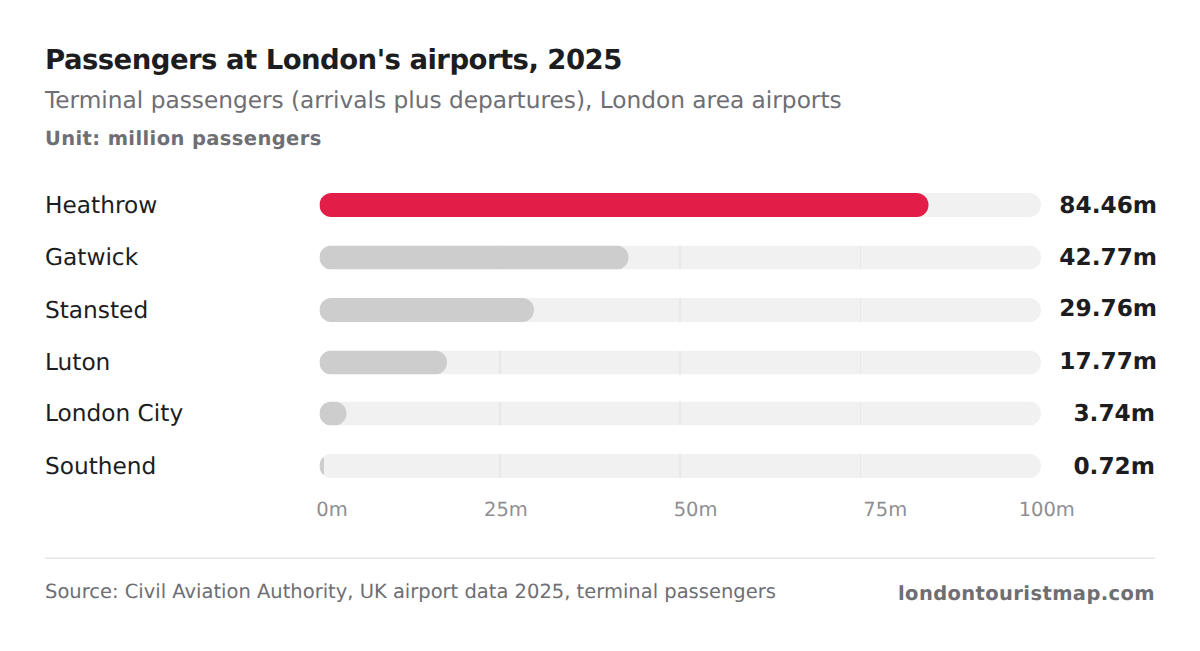
- Heathrow handled 84.46 million passengers.
- Gatwick handled 42.77 million.
- Southend handled 0.72 million.
The airports have almost recovered from the pandemic. Passengers fell from 181.0 million8 in 2019 to 38.3 million8 in 2021 and were back to 99.0%1 of the 2019 level in 2025. Heathrow is above its 2019 total of 80.9 million8; Southend, at 0.72 million8, is still far below its 2.04 million8 of 2019.
Projection: linear trend of 2015–2025 yearly values, 95% prediction range. Our calculation, not a forecast.
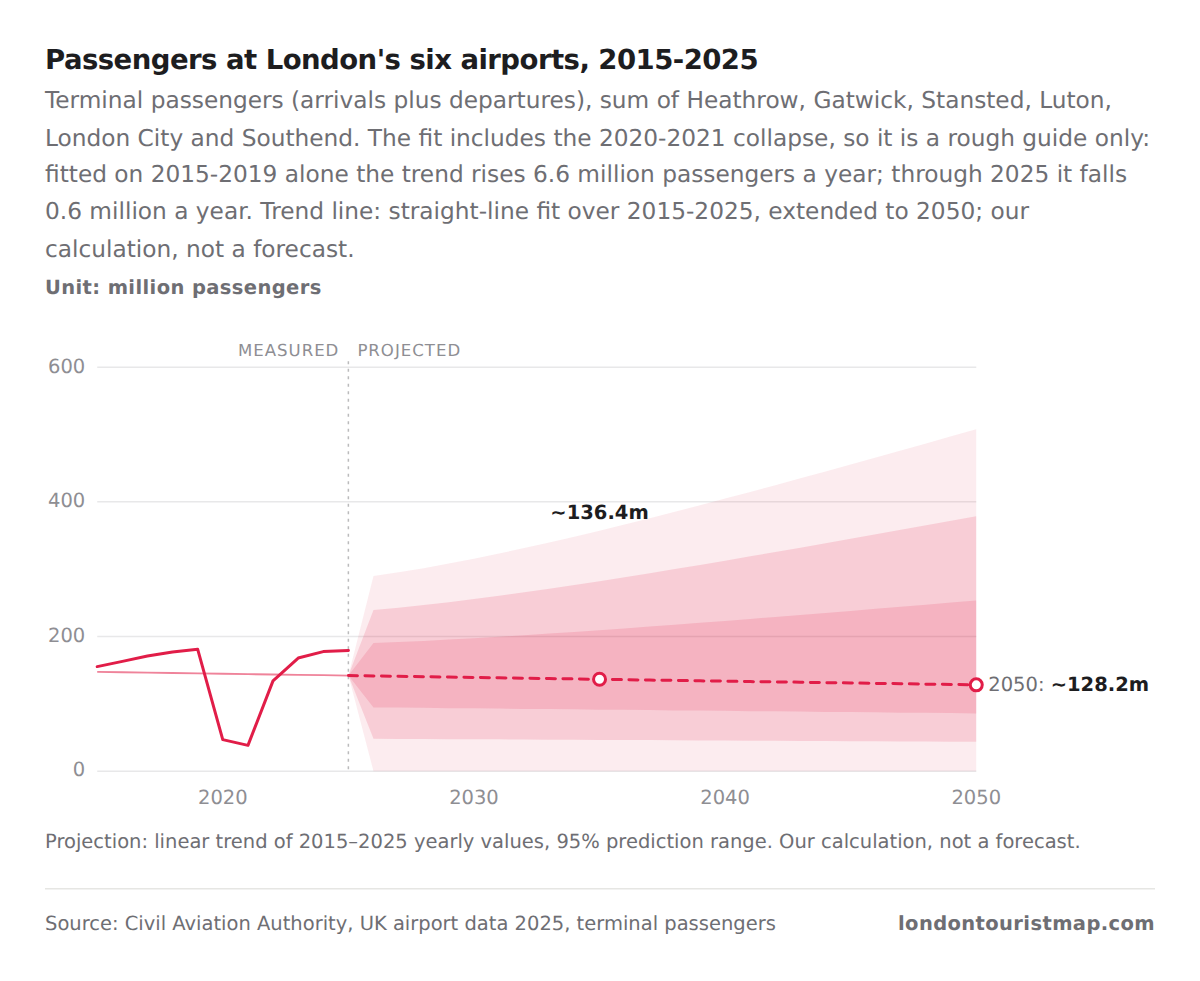
- Passengers reached 181.0 million in 2019.
- They fell to 38.3 million in 2021.
- 2025 had 179.2 million, 1.7 million short of 2019.
The table gives each airport's yearly total, so you can see which ones led the recovery.
| 2015 | 74.95m | 40.26m | 22.51m | 12.26m | 4.32m | 0.90m |
| 2016 | 75.67m | 43.11m | 24.32m | 14.64m | 4.54m | 0.87m |
| 2017 | 77.99m | 45.55m | 25.90m | 15.99m | 4.53m | 1.09m |
| 2018 | 80.10m | 46.08m | 28.00m | 16.77m | 4.82m | 1.48m |
| 2019 | 80.89m | 46.57m | 28.12m | 18.21m | 5.12m | 2.04m |
| 2020 | 22.11m | 10.17m | 7.54m | 5.55m | 0.91m | 0.40m |
| 2021 | 19.39m | 6.26m | 7.15m | 4.67m | 0.72m | 0.09m |
| 2022 | 61.60m | 32.83m | 23.29m | 13.32m | 3.01m | 0.09m |
| 2023 | 79.15m | 40.89m | 27.95m | 16.40m | 3.43m | 0.15m |
| 2024 | 83.86m | 43.24m | 29.69m | 16.94m | 3.57m | 0.29m |
| 2025 | 84.46m | 42.77m | 29.76m | 17.77m | 3.74m | 0.72m |
How many British residents visit London?
In 2024 British residents made 203.7 million1 overnight trips and day visits to London, almost ten times the 20.7 million4 visits from abroad that year. They made 15.1 million3 overnight trips to London in 2024, spending 37.3 million3 nights and £5.5 billion3 ($7.0 billion1). That made London the second most popular region of England for overnight trips, just behind the South West's 15.4 million3, and its share of all Britons' overnight trips in England rose from 15%3 in 2022 to 17%3 in 2024 as city breaks became more popular.3
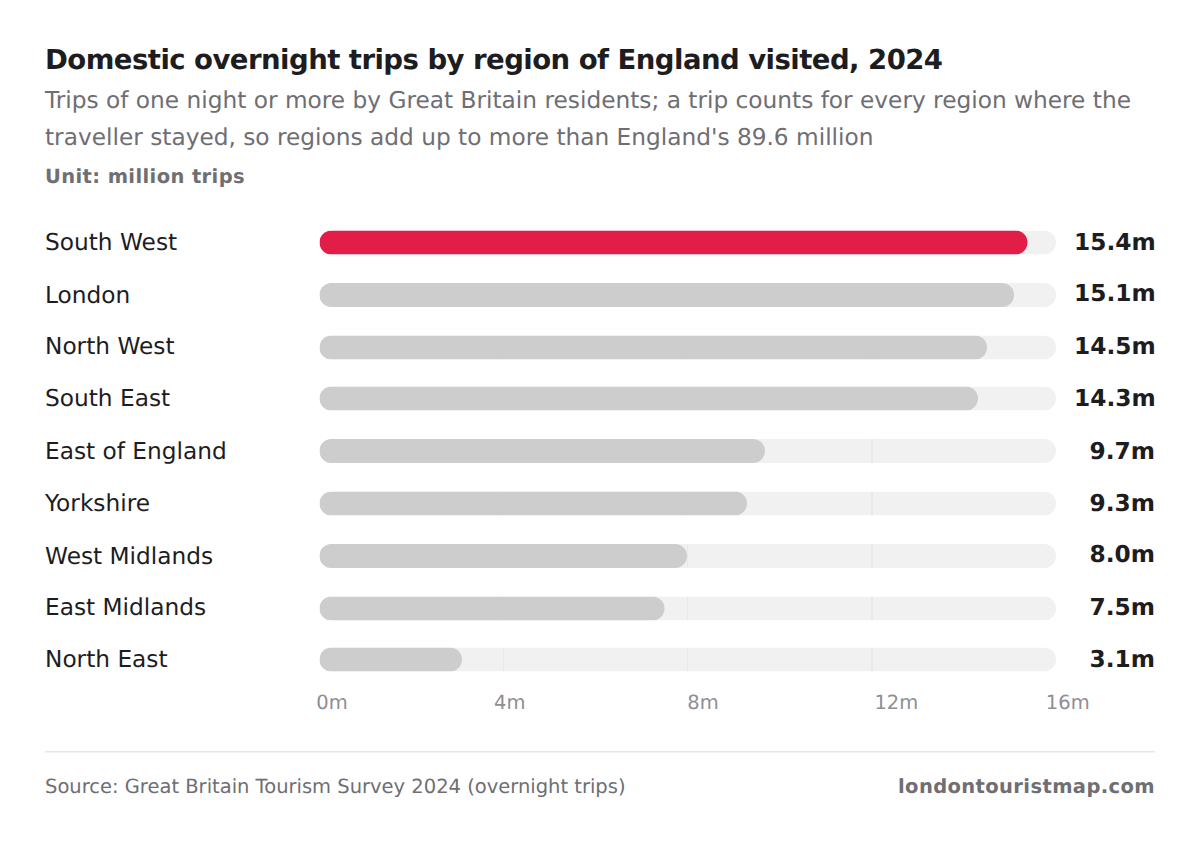
- The South West had 15.4 million trips.
- London had 15.1 million.
- The North East had 3.1 million.
Who are the domestic visitors? Londoners themselves, first of all: 28%3 of the overnight trips London residents took within England stayed in the capital. People from Scotland and Wales come next, with 24%3 and 21%3 of their England trips going to London; of England residents' own trips in England, 16%3 included London.
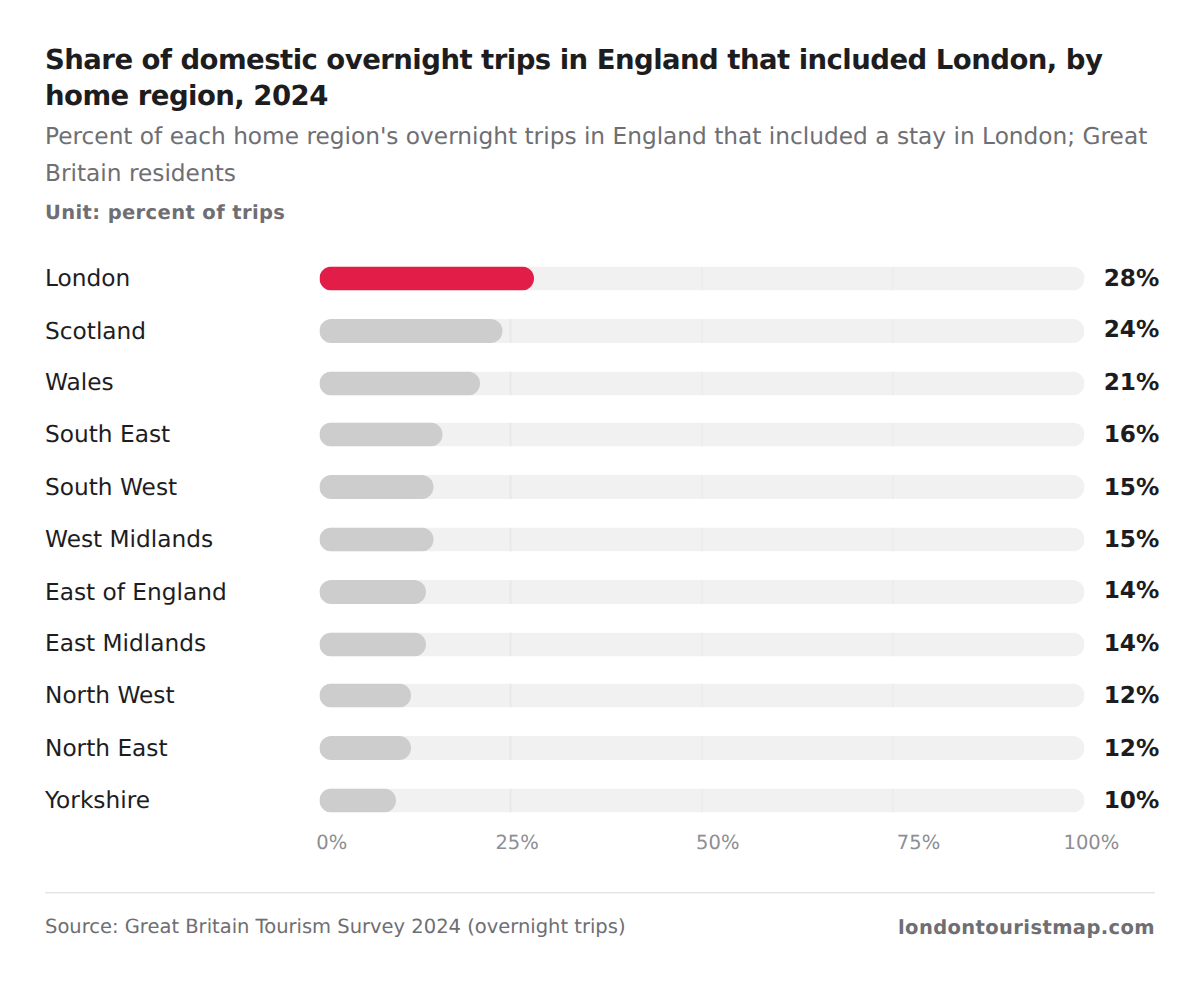
- Londoners: 28% of their England trips stayed in London.
- Scotland residents: 24%.
- Yorkshire residents: 10%.
Day trips are where London leads clearly. British residents made 188.6 million2 tourism day visits to London in 2024, 21%2 of all those in England and 25%2 of their spending, about £12.1 billion1 ($15.5 billion1).2 Visits fell 13%2 from 2023, but spending rose 10%2.
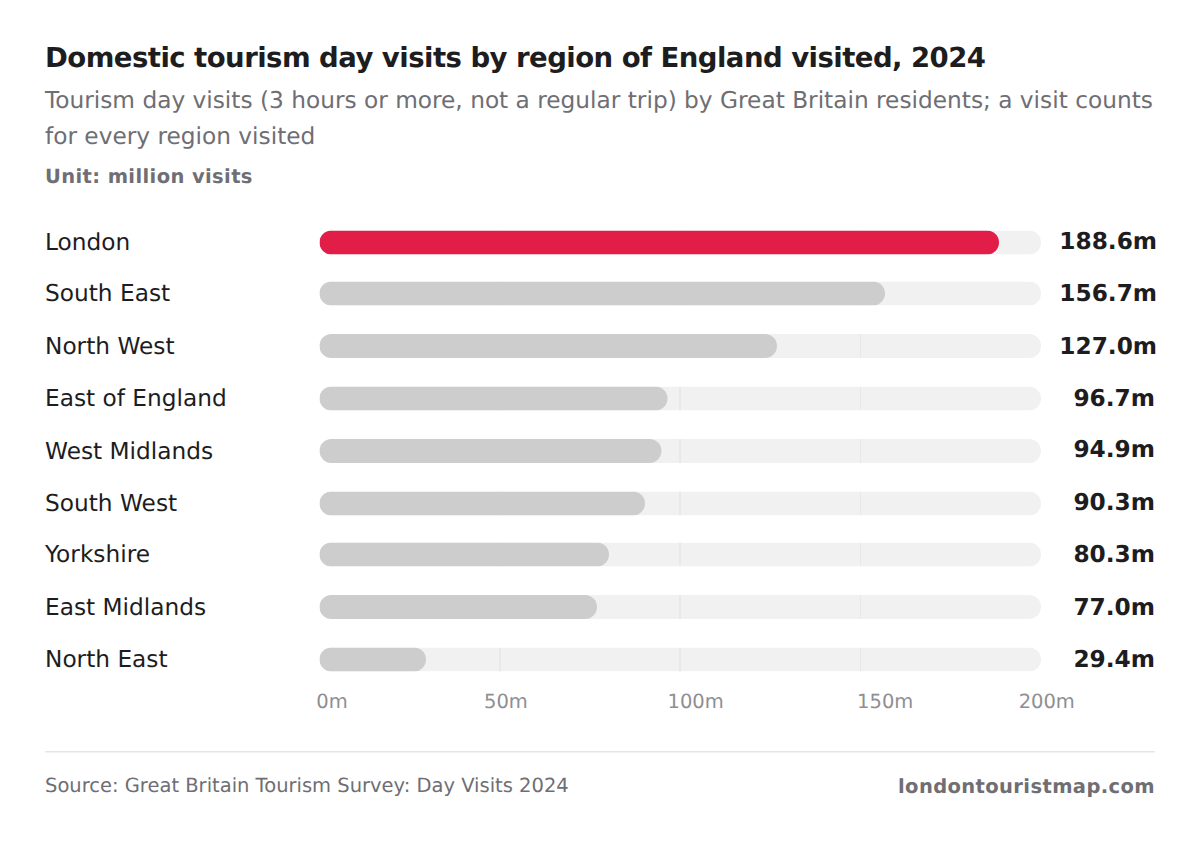
- London had 188.6 million day visits.
- The South East had 156.7 million.
- The North East had 29.4 million.
Holidays are a small part of domestic overnight travel to London: 3.3 million3 of the 15.1 million3 trips; the other 11.8 million1 were for other reasons. The table puts the domestic measures side by side.
| Overnight trips to London, all purposes | 15.1m | 37.3m | £5,456m |
| Holiday overnight trips to London | 3.3m | 9.6m | £1,443m |
| Non-holiday overnight trips to London (our subtraction) | 11.8m | 27.7m | £4,013m |
| Tourism day visits to London (spending: our estimate, 25% of England's) | 188.6m | - | £12,101m |
What are London's most visited attractions?
From visitors to the places they fill. Among the attractions that report their figures to the leading attractions association, the Natural History Museum was the most visited in London and the whole UK in 2025, with 7.1 million7 visits, up 13%7, overtaking the British Museum, which led in 2024.7 14 The British Museum followed with 6.4 million7, then Tate Modern with 4.5 million7 and the National Gallery with 4.1 million7, up 29%7. The Tower of London, with 2.8 million7, drew the most visits among London sites that charge everyone for entry.7
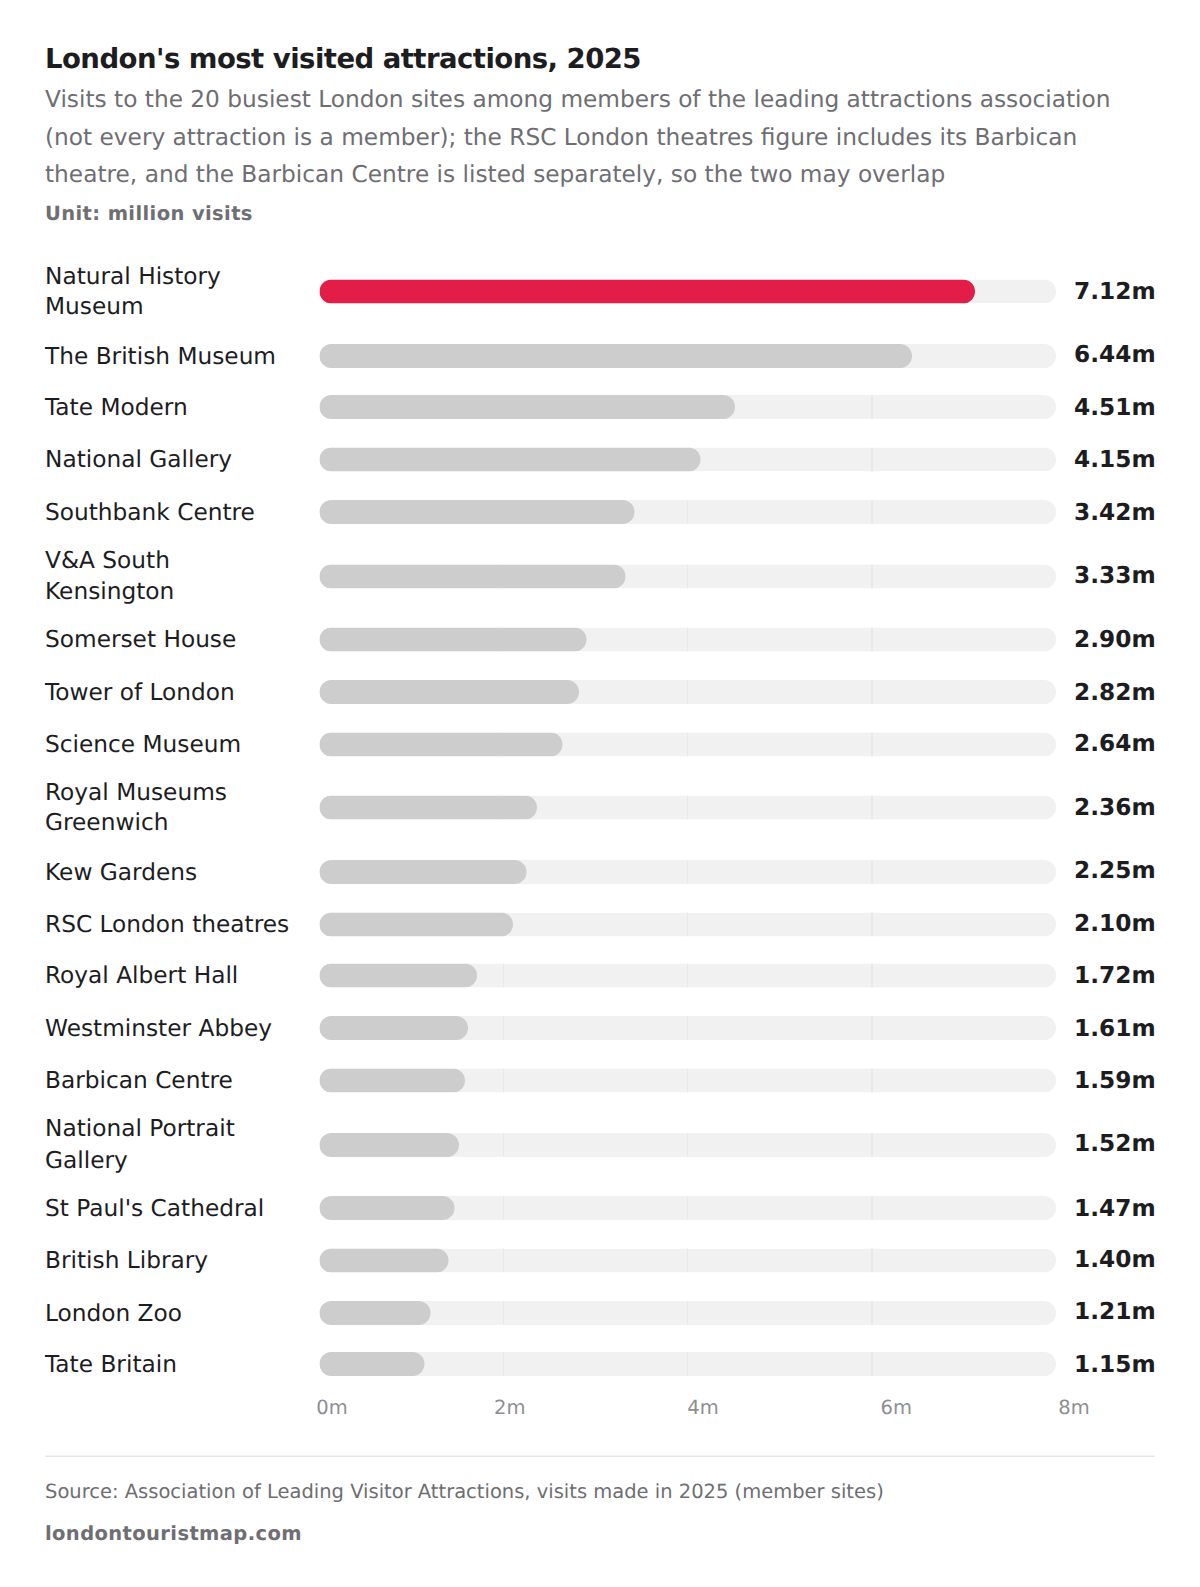
- The Natural History Museum had 7.12 million visits.
- The British Museum had 6.44 million.
- Tate Britain, 20th, had 1.15 million.
Most of the big names held steady or slipped slightly against 2024, while a few grew sharply, including the National Gallery and the Royal Shakespeare Company's London theatres. The table shows each site's 2024 total, its change and how it charges for entry.
| Natural History Museum | 6,301,972 | 13% | Free entry (paid exhibitions or events) |
| The British Museum | 6,479,952 | −1% | Free entry (paid exhibitions or events) |
| Tate Modern | 4,603,025 | −2% | Free entry (paid exhibitions or events) |
| National Gallery | 3,203,451 | 29% | Free entry (paid exhibitions or events) |
| Southbank Centre | 3,734,075 | −8% | Free entry (paid exhibitions or events) |
| V&A South Kensington | 3,525,700 | −5% | Free entry (paid exhibitions or events) |
| Somerset House | 3,074,736 | −6% | Free entry (paid exhibitions or events) |
| Tower of London | 2,902,385 | −3% | Paid entry |
| Science Museum | 2,827,242 | −7% | Free entry (paid exhibitions or events) |
| Royal Museums Greenwich | 2,255,753 | 5% | Other |
| Kew Gardens | 2,273,976 | −2% | Paid entry |
| RSC London theatres | - | 49% | Free entry (paid exhibitions or events) |
| Royal Albert Hall | 1,753,371 | −2% | Other |
| Westminster Abbey | 1,717,296 | −6% | Paid entry |
| Barbican Centre | 1,541,194 | 3% | Free entry (paid exhibitions or events) |
| National Portrait Gallery | 1,578,065 | −3% | Free entry (paid exhibitions or events) |
| St Paul's Cathedral | 1,493,184 | −2% | Paid entry |
| British Library | 1,361,002 | 3% | Free entry (paid exhibitions or events) |
| London Zoo | 1,239,133 | −2% | Paid entry |
| Tate Britain | 1,226,872 | −6% | Free entry (paid exhibitions or events) |
Free entry is the rule at the top. The 527 London member sites reported 70.0 million1 visits in 2025, and 49.7 million1 of them, 71.0%1, were to sites with free general entry, where only special exhibitions or events cost money; that group includes arts centres and theatres such as the Southbank Centre as well as the free museums. Sites that charge everyone took 16.2 million1.
- Free entry49.68m71%
- Paid entry16.21m23.2%
- Other charging4.08m5.8%
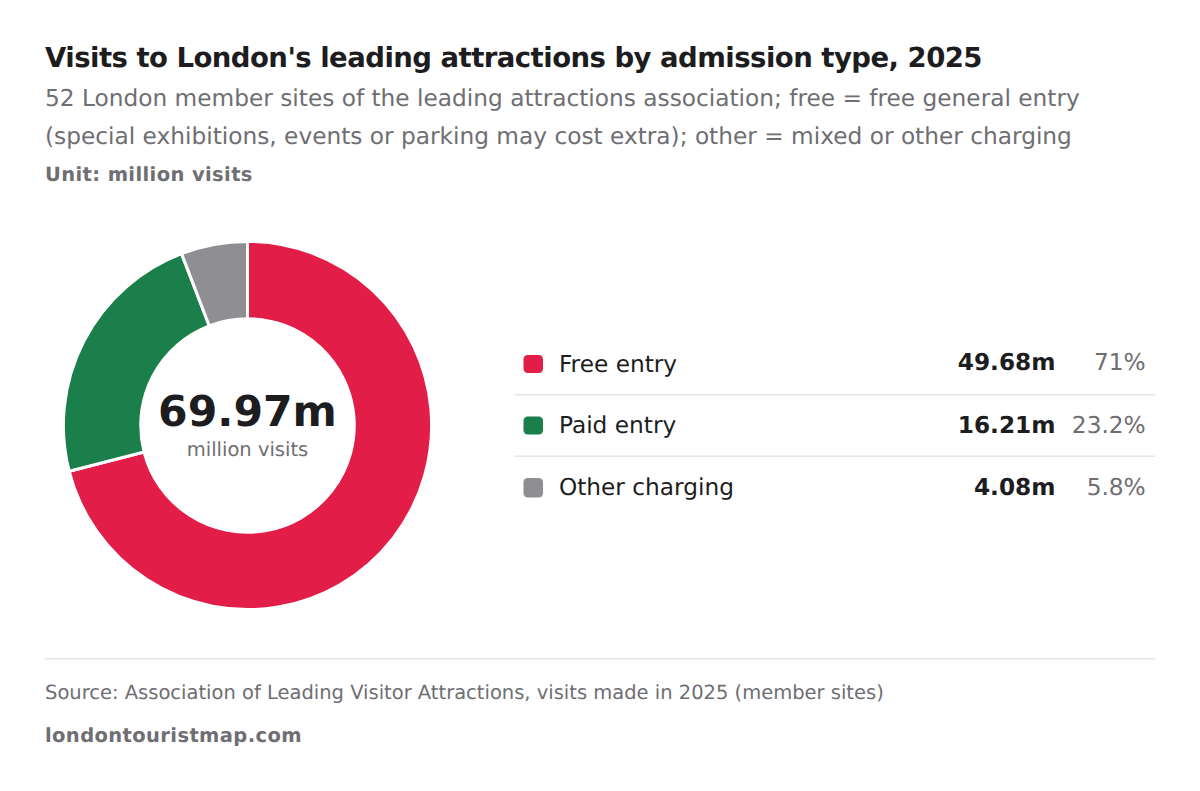
- Free-entry sites had 49.68 million visits.
- Paid-entry sites had 16.21 million.
- Other charging models had 4.08 million.
How busy is London's public transport?
From museums to the Tube. London's Underground carried 1,204.2 million9 journeys in the financial year 2025-26, about 3.3 million1 a day, and the Elizabeth line, which runs under central London alongside it, carried 242.2 million9.9 Taken alone, the Underground is at 90.1%1 of its 2019-20 level, but the Elizabeth line has taken over part of its traffic: together the two carried 1,446.4 million1 journeys, 3.6%1 more than the 1,396.4 million1 of 2019-20. That base year already includes the first weeks of the March 2020 lockdown; the Underground alone peaked at 1,384.7 million9 in 2018-19.
Projection: linear trend of 2010–2025 yearly values, 95% prediction range. Our calculation, not a forecast.
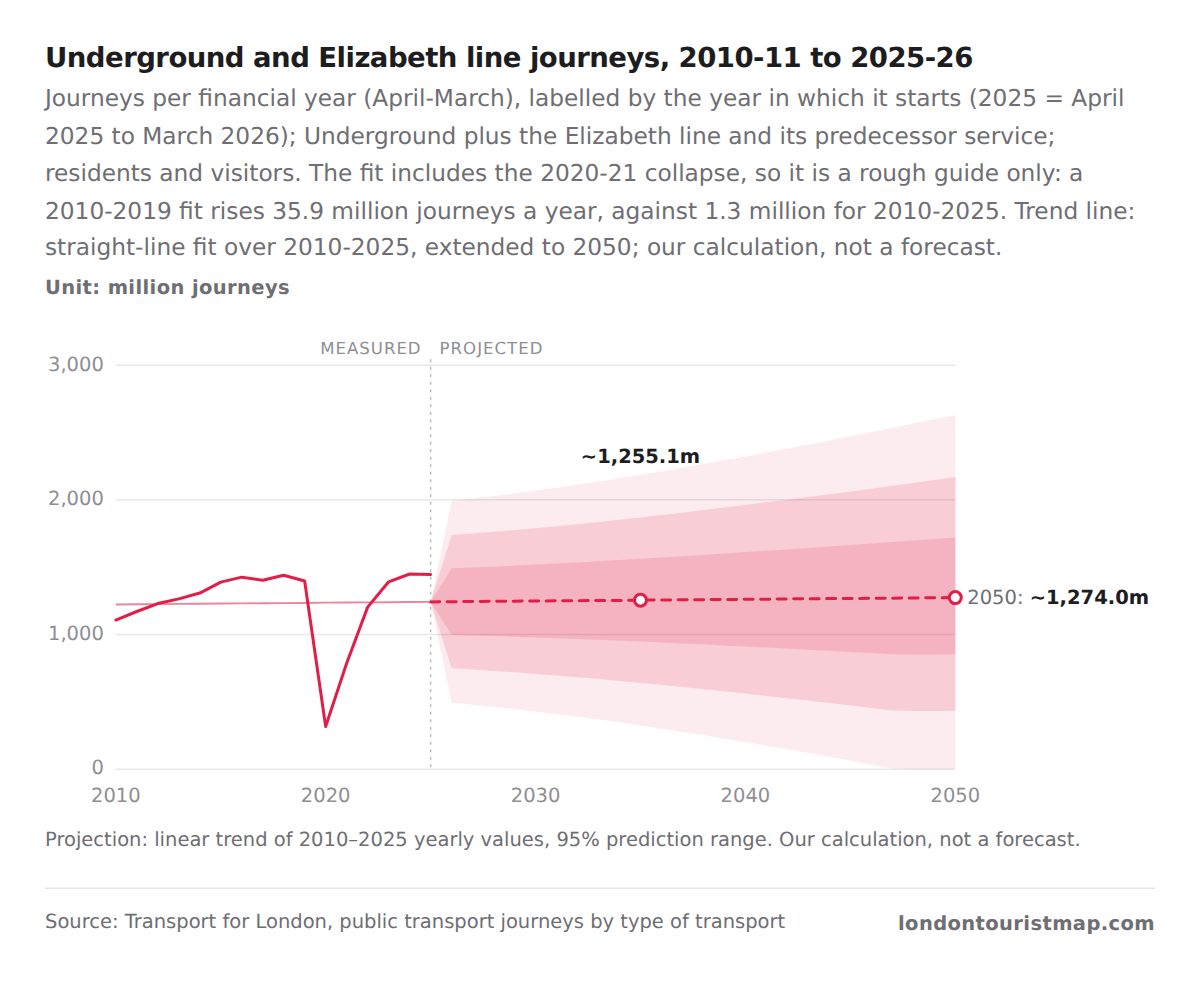
- Rail journeys were 1,446.4 million in 2025-26.
- They fell to 316.4 million in 2020-21.
- 2019-20 had 1,396.4 million.
Buses are the one part of the network clearly below its old level. They carried 1,785.6 million9 journeys in 2025-26, 84.4%1 of the 2,116.2 million9 of 2019-20, and bus use was already drifting down before the pandemic, from a high of 2,385.2 million9 in 2014-15.
Projection: linear trend of 2010–2025 yearly values, 95% prediction range. Our calculation, not a forecast.
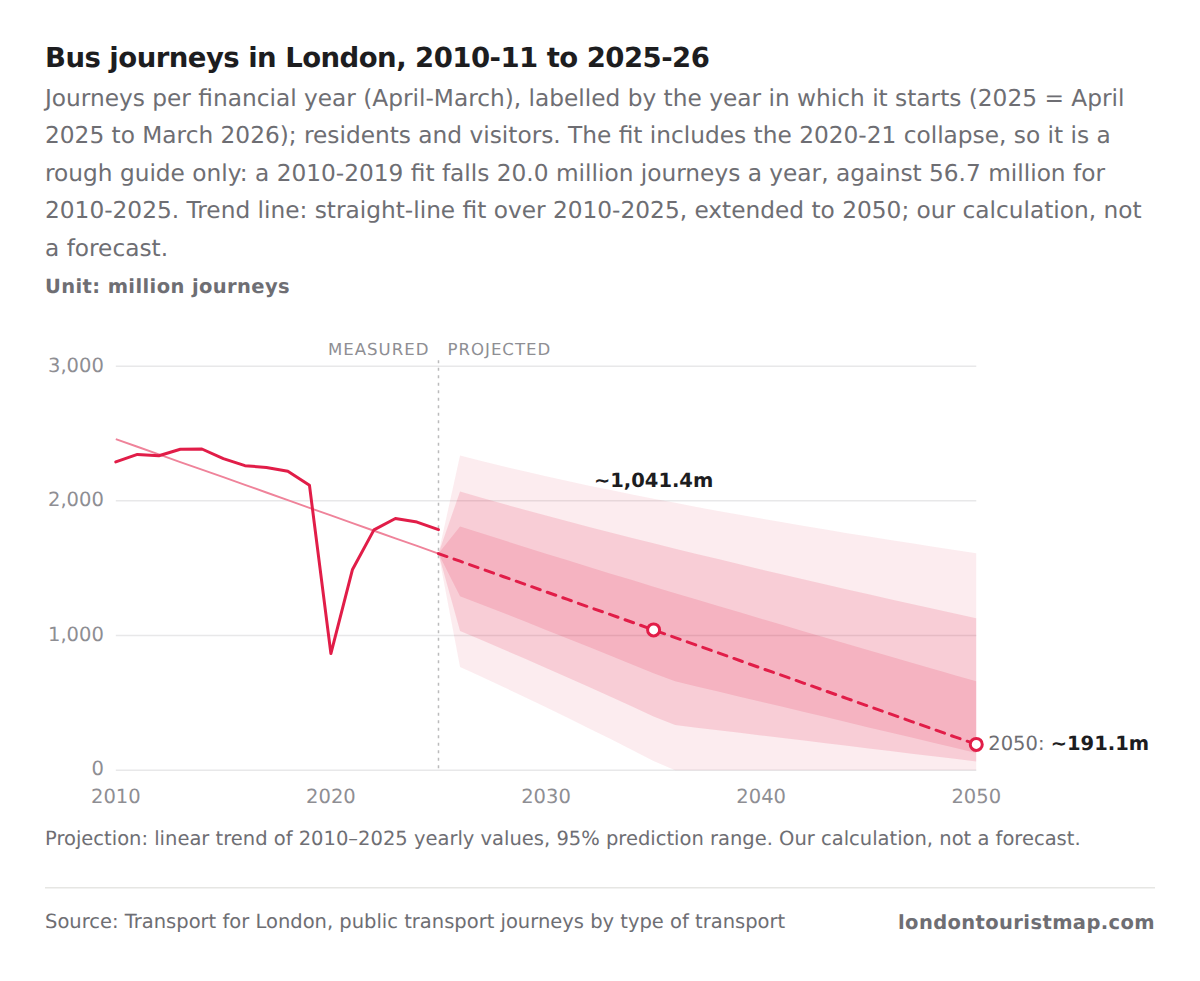
- Bus journeys peaked at 2,385.2 million in 2014-15.
- They fell to 865.2 million in 2020-21.
- 2025-26 had 1,785.6 million.
The Overground carried 190.0 million9 journeys in 2025-26 and the DLR 90.7 million9; even the cable car across the Thames carried 1.4 million9. The figures count every passenger, Londoners and visitors alike, so they show how busy the network is rather than how many trips tourists make. The chart ranks every mode.
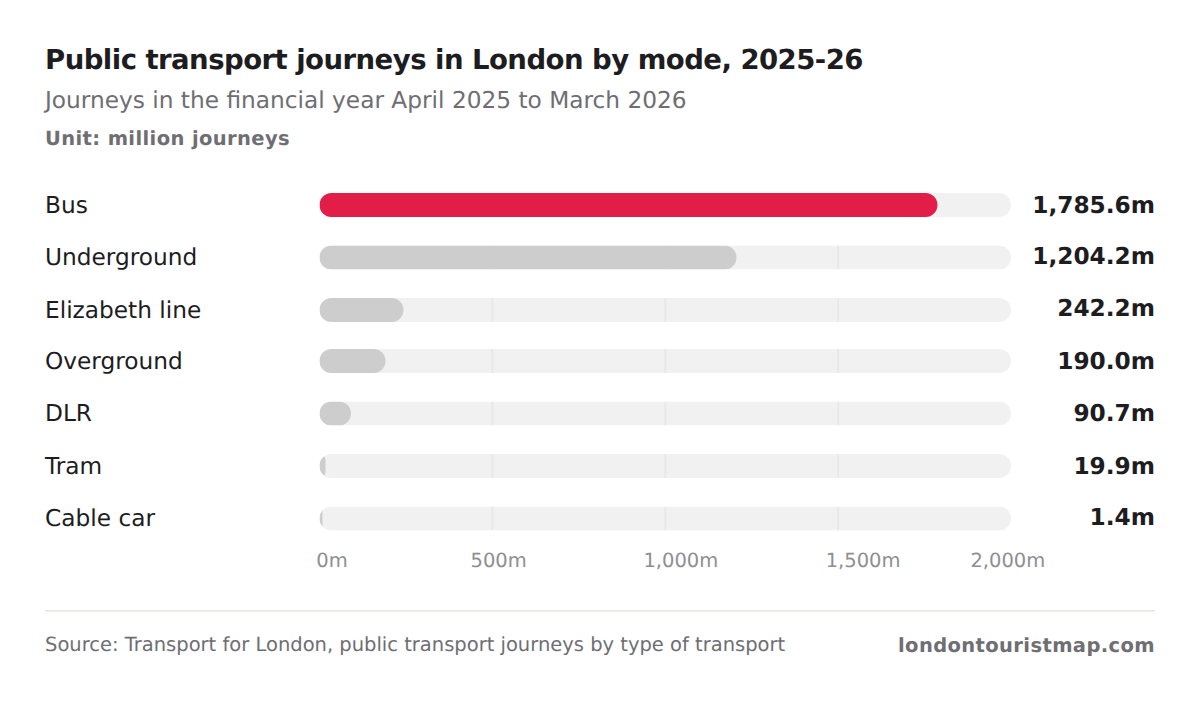
- Buses carried 1,785.6 million journeys.
- The Underground carried 1,204.2 million.
- The cable car carried 1.4 million.
London's hotels and hospitality jobs
Hotels cluster in the centre and by Heathrow. In 2024 hotels and similar accommodation employed 76,00010 people in London, and Westminster alone had 30,00010 of those jobs, 39.5%1. Relative to the size of the local job market, Kensington and Chelsea is the most hotel-heavy borough, with 39.11 hotel jobs per 1,000 jobs, followed by Westminster with 35.81 and Hillingdon, home of Heathrow, with 25.51. The map shades every borough.
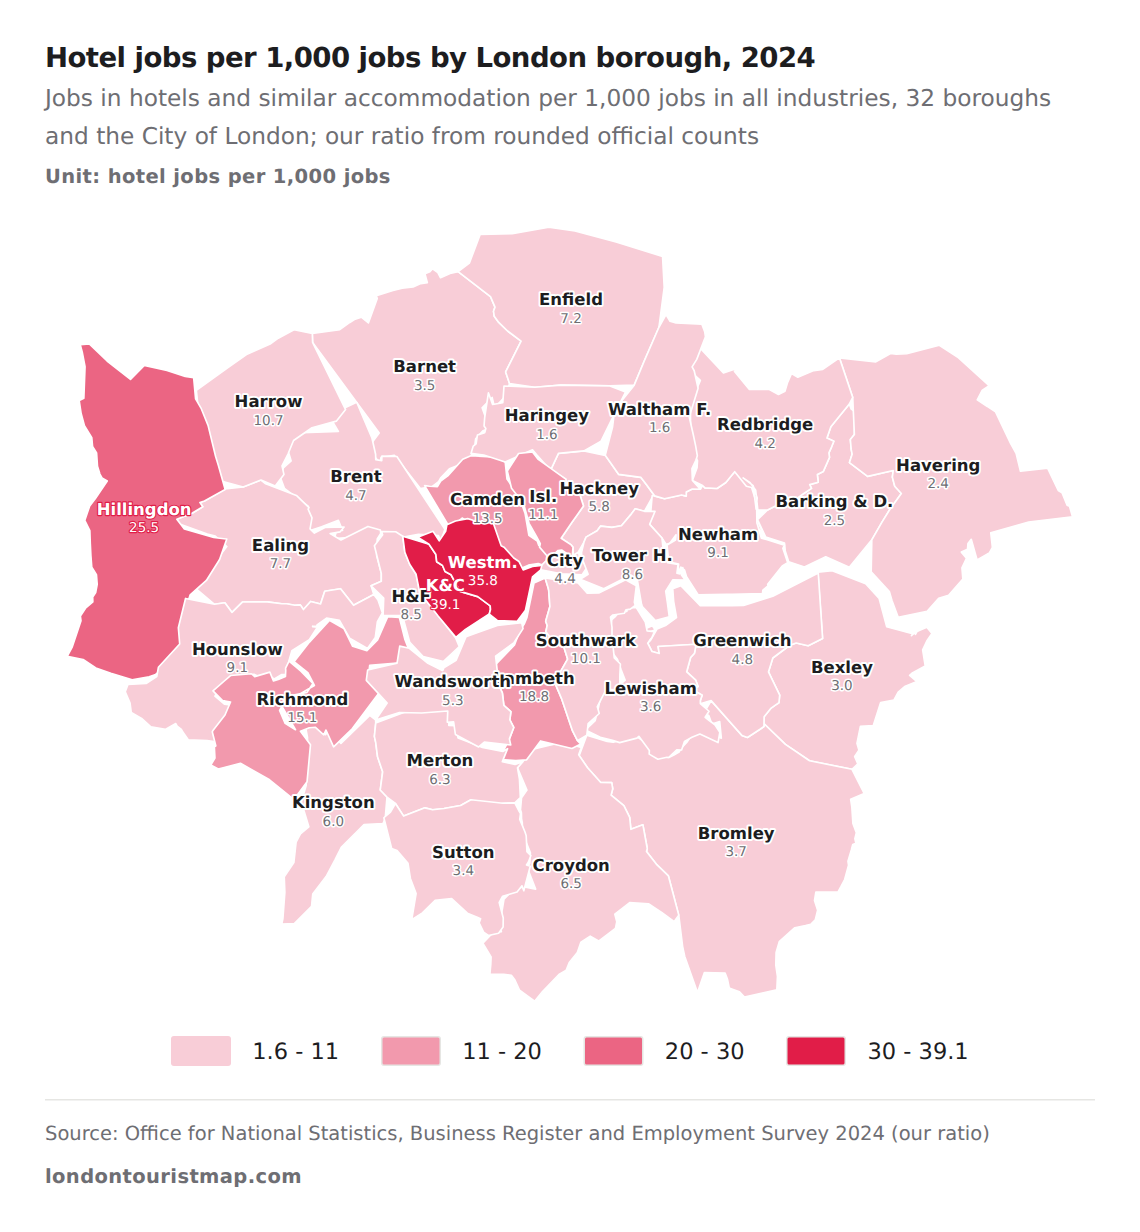
- Kensington and Chelsea had 39.1 hotel jobs per 1,000 jobs.
- Westminster had 35.8.
- Haringey and Waltham Forest had 1.6 each.
Counting premises rather than jobs tells the same story. London had 2,33015 hotel premises in March 2026, and 60015 of them, 25.8%1, were in Westminster, followed by Camden with 20515 and Kensington and Chelsea with 15515.
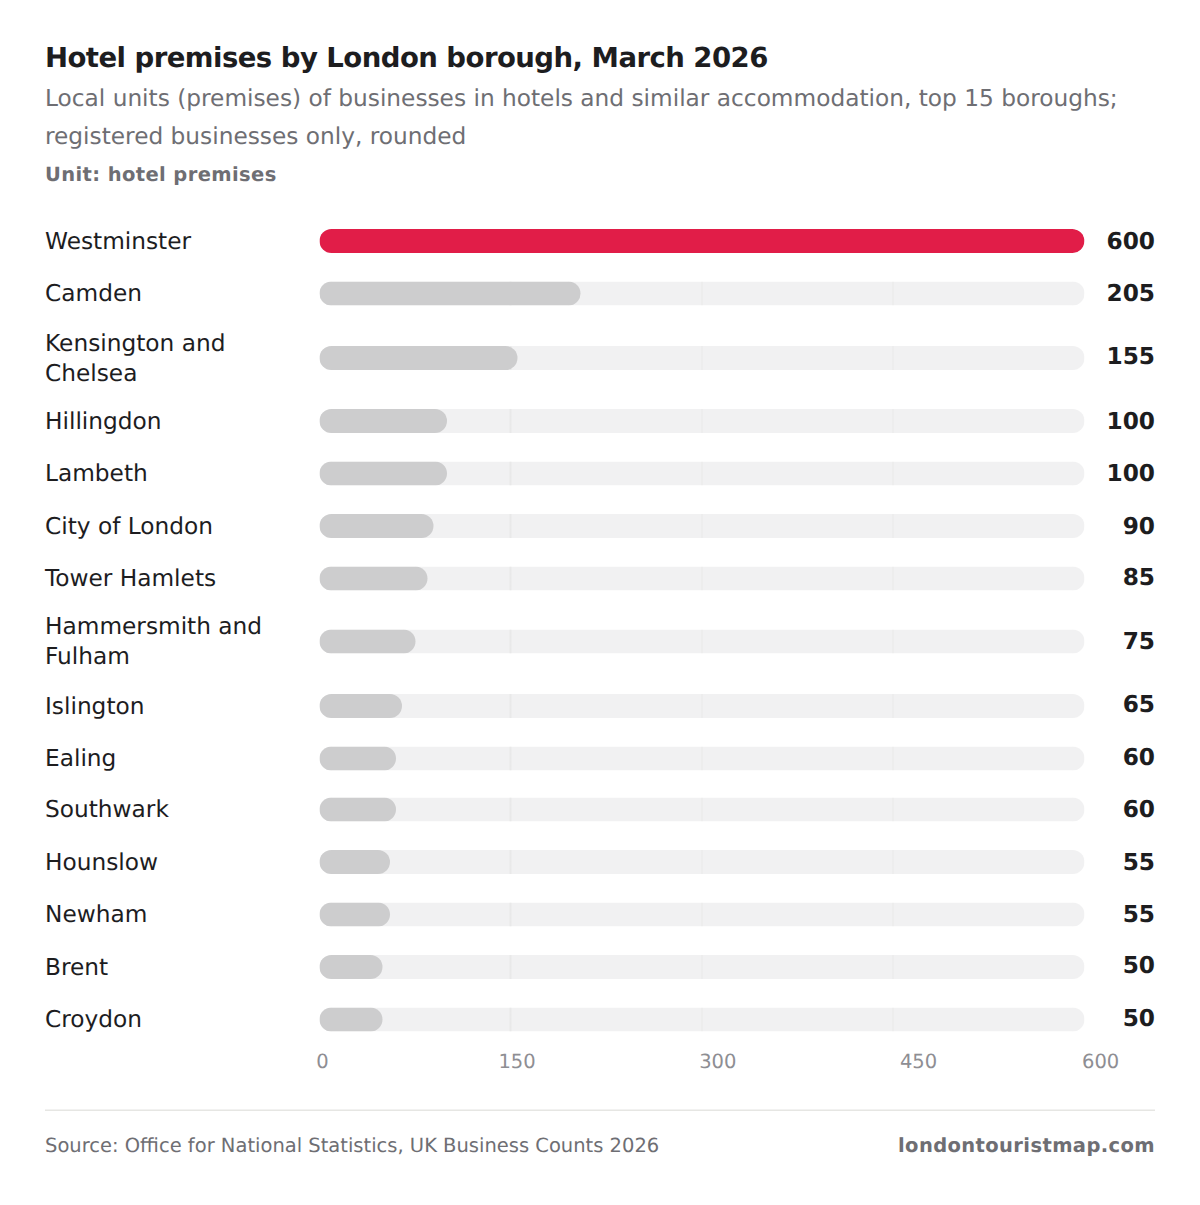
- Westminster had 600 hotel premises.
- Camden had 205.
- Kensington and Chelsea had 155.
The table lists hotel jobs and all jobs for every borough. The counts are rounded, so small boroughs' figures are approximate.
| 1 | Westminster | 30,000 | 837,000 |
| 2 | Camden | 6,000 | 446,000 |
| 3 | Hillingdon | 5,000 | 196,000 |
| 4 | Kensington and Chelsea | 5,000 | 128,000 |
| 5 | City of London | 3,000 | 676,000 |
| 6 | Islington | 3,000 | 271,000 |
| 7 | Lambeth | 3,000 | 160,000 |
| 8 | Southwark | 3,000 | 297,000 |
| 9 | Tower Hamlets | 3,000 | 350,000 |
| 10 | Hounslow | 1,500 | 164,000 |
| 11 | Hammersmith and Fulham | 1,250 | 147,000 |
| 12 | Newham | 1,250 | 138,000 |
| 13 | Richmond upon Thames | 1,250 | 83,000 |
| 14 | Ealing | 1,000 | 130,000 |
| 15 | Hackney | 1,000 | 173,000 |
| 16 | Croydon | 800 | 123,000 |
| 17 | Enfield | 800 | 111,000 |
| 18 | Harrow | 800 | 75,000 |
| 19 | Wandsworth | 700 | 131,000 |
| 20 | Brent | 600 | 129,000 |
| 21 | Barnet | 500 | 142,000 |
| 22 | Merton | 500 | 79,000 |
| 23 | Greenwich | 450 | 94,000 |
| 24 | Kingston upon Thames | 450 | 75,000 |
| 25 | Bromley | 400 | 108,000 |
| 26 | Redbridge | 350 | 84,000 |
| 27 | Lewisham | 250 | 70,000 |
| 28 | Sutton | 250 | 73,000 |
| 29 | Bexley | 225 | 74,000 |
| 30 | Havering | 225 | 92,000 |
| 31 | Barking and Dagenham | 150 | 59,000 |
| 32 | Waltham Forest | 150 | 91,000 |
| 33 | Haringey | 125 | 78,000 |
Hotels are only one part of the visitor economy. In 2024 London had 82,00010 jobs in all accommodation, 367,00010 in restaurants, cafes, pubs and other food and drink services, and 23,00010 in travel agencies and tour operators: 472,0001 jobs together, 8.0%1 of all jobs in London. Restaurants and pubs serve Londoners as much as visitors, so this is the size of the hospitality sector, not a count of tourism jobs. Accommodation jobs fell from 88,00010 in 2019 to 55,00010 in 2021 and have not quite recovered.
Projection: linear trend of 2015–2024 yearly values, 95% prediction range. Our calculation, not a forecast.
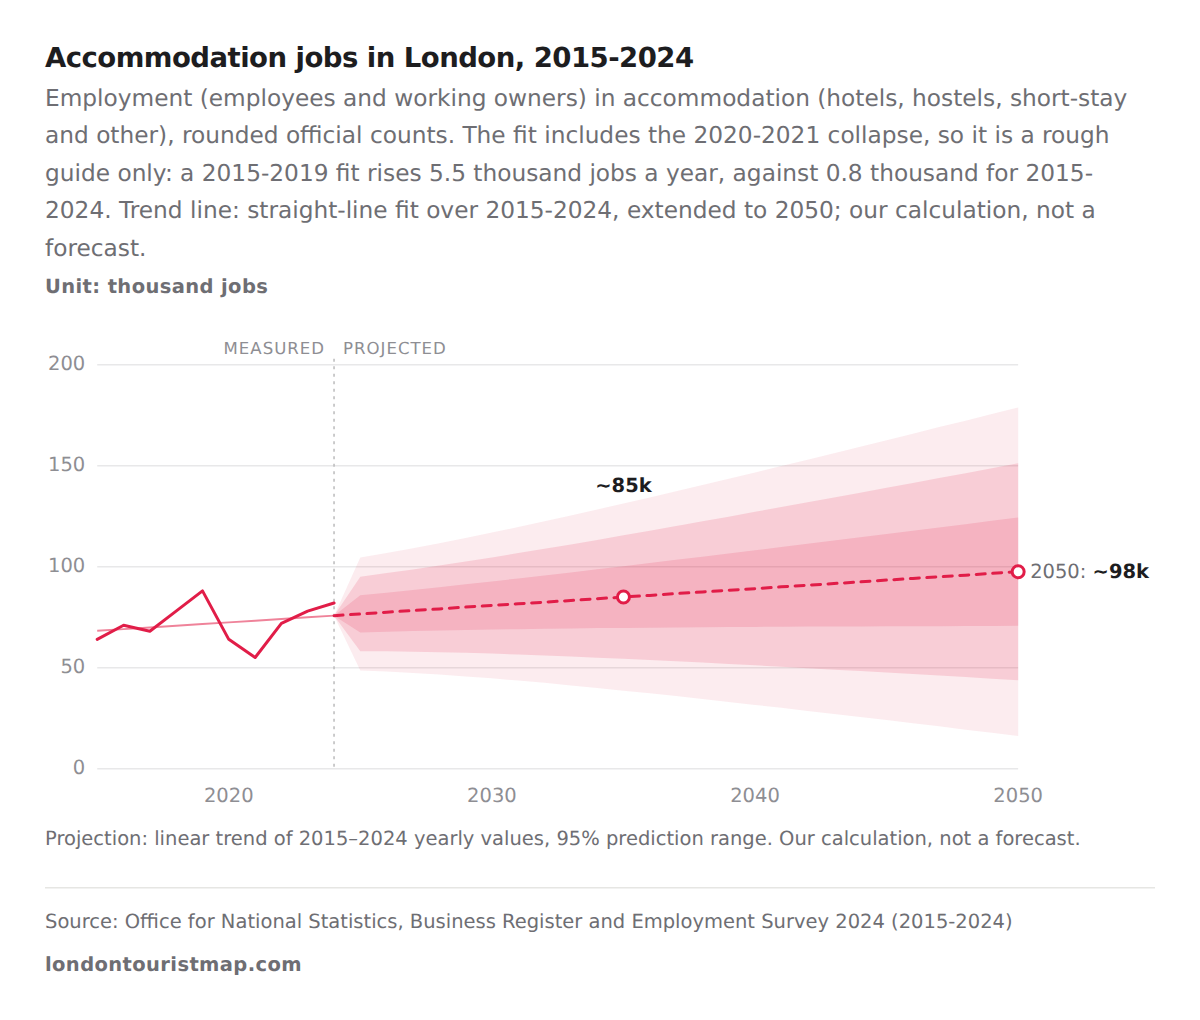
- Accommodation had 88 thousand jobs in 2019.
- It fell to 55 thousand in 2021.
- 2024 had 82 thousand.
| 2015 | 64k | 317k | 26k |
| 2016 | 71k | 335k | 28k |
| 2017 | 68k | 323k | 25k |
| 2018 | 78k | 367k | 27k |
| 2019 | 88k | 344k | 28k |
| 2020 | 64k | 326k | 20k |
| 2021 | 55k | 342k | 13k |
| 2022 | 72k | 418k | 21k |
| 2023 | 78k | 363k | 27k |
| 2024 | 82k | 367k | 23k |
How London compares with other world cities
By one industry ranking, London was the third most visited city in the world by international arrivals in 2025, behind Bangkok, with 30.3 million16, and Hong Kong.16 The same ranking put Paris first overall for the fifth year running, on a wider score than arrivals alone.16 The ranking is an industry estimate made before the year ended, and its arrival count differs from the official one. Within Britain there is no contest. 52%5 of Great Britain's international visits in 2025 included London, and London had almost five times the visits of any other English region,5 1 so for most overseas visitors a trip to Britain means a stay in London.
Visiting London in 2026: entry rules, a possible levy and the outlook
Most visitors who do not need a visa, including those from Europe, the US, Australia and Canada, now need an electronic travel authorisation (ETA) before they travel. It costs £2017 (about $261 at the 2025 average rate), lasts 2 years17 or until the passport expires, and covers any number of trips of up to 6 months17 each.17
London has no tourist tax yet. In September 2026 the government confirmed it will legislate to give mayors in England, including the Mayor of London, a power to charge an overnight visitor levy; the law still has to pass Parliament, and the government expects local plans for the money by March 2028.18 A levy would be a percentage of the room price, collected by accommodation providers. Each area must consult first and give businesses notice of the start date; there is no national minimum notice period.18 City Hall has set up a project team to scope a London levy, with no rate or date announced.19
The official outlook covers the whole UK: 44.2 million20 inbound visits and £33.9 billion20 of spending in 2026, 2%20 more than its own 2025 estimate of 43.6 million20 visits and £33.2 billion20, made in August 2026 before the 2025 survey results above were published. Against the 40.8 million5 visits recorded for 2025, the forecast would mean about 8%1 more visits. Visitors from Europe are expected to rise 4%20 and long-haul visits to fall 3%20.20 That mix matters for London, where visitors from the United States alone bring 27.6%1 of international spending.
| ETA cost | £20 | in force |
| ETA validity | 2 years or until the passport expires | in force |
| Longest stay per trip on an ETA | 6 months | in force |
| Overnight visitor levy in London | none yet; a percentage of the room price if introduced | planned; legislation pending; local plans expected by March 2028 |
| Notice before a levy starts | set locally; no national minimum | government response, September 2026 |
| London levy preparation | City Hall project team scoping a levy; no rate or date | decision of 18 March 2026 |
| UK inbound visits forecast for 2026 | 44.2 million (+2% on a 2025 estimate of 43.6 million) | forecast, August 2026 |
| UK inbound spending forecast for 2026 | £33.9 billion (+2% on a 2025 estimate of £33.2 billion) | forecast, August 2026 |
What these numbers mean for a London trip
You will rarely have the city to yourself. Between July and September 2025 London hosted more than 5.4 million5 international visits on top of its own residents and day-trippers, and the quieter months are January to March, when visits drop to 4.0 million5 a quarter. The busiest museums are free, so a visit costs time in a queue rather than money: the Natural History Museum and the British Museum together drew 13.6 million1 visits in 2025.
Budget-wise, the average international visitor spends £1486 a night in London, covering the room, food, transport and shopping. Holidaymakers spend more, £1916 a night. For getting in and around, Heathrow handles nearly half of all London air passengers, and the Underground, Elizabeth line and buses carry millions of journeys every day. If you are coming from a visa-free country, budget £2017 for the ETA before you book.
FAQ
How many tourists visit London each year?
Which country sends the most visitors to London?
The United States: 3.7 million visits in 2025, almost a fifth of all international visits.6
How much does a tourist spend in London?
An international visitor spent £820 per visit and £148 per night on average in 2025, staying 5.5 nights.6
What is the busiest time of year in London?
July to September, with 5.4 million international visits in 2025; January to March is the quietest, with 4.0 million.5
Does London have a tourist tax?
Do I need an ETA to visit London?
Visitors from most visa-free countries need one. It costs £20 and lasts 2 years or until the passport expires.17
Conclusions
- London is Britain's front door for overseas visitors. 52% of all international visits to Great Britain in 2025 included London, and the city took £15.8 billion of the UK's £29.8 billion of inbound spending.5
- The money depends on a few long-haul markets. Americans made 19.0% of visits but 27.6% of spending, and visitors from Saudi Arabia and the UAE spent over £2,500 per visit, so a weaker long-haul outlook for 2026 weighs more on London's spending than its visitor count suggests.6 20
- Business travel has not come back like holidays. Holiday visits drive the totals, but 2025's 2.8 million business visits were 30% below 2019's 4.0 million, although the counting method changed in 2024, so the exact size of the drop is uncertain; the airports are back to 99.0% of their 2019 passengers.6 13 8
- Free-entry sites carry London's attraction economy. 71.0% of visits to the city's leading attractions went to free-entry sites, led by the Natural History Museum, the most visited UK attraction among those that report their figures.7
- Hotels concentrate in a few boroughs. Westminster holds 39.5% of London's hotel jobs and a quarter of its hotel premises, so most receipts from any London-wide overnight levy would come from a small part of the city.10 15 18
Methodology
- International visits to London 2002-2025 (2020 not published); 2025 by country, purpose and quarter.
- Purpose 2002-2019, mode of travel and length of stay 2019 (newest London breakdowns of these).
- Domestic overnight trips and day visits 2024; attractions 2024-2025; airports 2015-2025.
- Public transport 2010-11 to 2025-26; jobs 2015-2024; hotel premises March 2026; all 33 boroughs.
Definition. International visit = a stay by an overseas resident (including UK nationals living abroad) that included at least one night in London, counted when the visitor leaves the UK; a visit can include several regions. Spending in London = the part of a visitor's reported trip spending attributed to London (regional spending adds up to the UK total, while visits overlap), current pounds, excluding fares to and from the UK. Domestic overnight trip = one night or more away from home by a Great Britain resident; tourism day visit = 3 hours or more, not a regular trip. Attraction visits = figures reported by member sites of the leading attractions association, not every attraction. Airport passengers = terminal passengers, arrivals plus departures, all nationalities. Public transport journeys = financial years April-March. Hotel jobs = employment in hotels and similar accommodation (industry class 55.10), rounded.
Data sources. ONS International Passenger Survey as published by VisitBritain (2025 nations and regions update and pivot, 2019-2024 pivot (used for 2019-2024), regional spread 2002-2023) and the Greater London Authority's London file (2002-2019); Great Britain Tourism Survey 2024 overnight and day-visit reports; Association of Leading Visitor Attractions 2024 and 2025; Civil Aviation Authority UK airport data 2025; Transport for London journeys by type of transport; ONS Business Register and Employment Survey 2024 and UK Business Counts 2026 (Nomis); Bank of England annual average exchange rates; GOV.UK pages on the ETA and the overnight visitor levy; VisitBritain 2026 forecast; Euromonitor International city ranking 2025 (industry estimate, rank only). Borough boundaries: ONS Open Geography Portal, Local Authority Districts May 2024, generalised.
Calculations. USD = GBP x the Bank of England annual average USD per GBP of the same year (2025: 1.3185). Spending per visit and per night = spending / visits and spending / nights. 2025 London totals = sum of the four quarters of the regional pivot (matches the published 19,292 thousand visits and £15,824 million). Quarterly 2010-2019 average = mean of ten years from the London file's detailed rows. Public transport years = sum of thirteen four-week periods. Hotel jobs per 1,000 jobs = hotel jobs / all jobs x 1,000 from rounded counts. Day-visit spending in London (about £12.1 billion) = 25% of England's £48.4 billion. Trend lines on single-series yearly charts (visits, London's share, airport passengers, rail and bus journeys, accommodation jobs) are ordinary least-squares straight lines over the stated years, extended to 2050 with a 95% prediction range: our calculation, not a forecast; each fit includes the 2020-2021 collapse. Multi-series charts carry no trend line. The 2026 UK forecast was made before the 2025 survey results and is measured against its own 2025 estimate.
Limitations. The International Passenger Survey changed method in July 2024; 2024 and 2025 are official statistics in development and are not directly comparable with earlier years. Regional and country estimates rest on smaller samples (the smallest market shown rests on 188 interviews). Mode of travel and length of stay for London are only available to 2019. Domestic 2025 regional figures were not yet published. There is no official London series for hotel occupancy, room rates, room counts or short-term lets, and the official Channel Tunnel passenger table stopped in 2021, so these are not shown. Employment counts are rounded. The world-city rank is an industry estimate with its own arrival definitions.
Sources
- London Tourist Map. “London Tourist Map calculations.” own calculation, 2026. Methodology. Accessed 2026-10-23. Back to text
- VisitEngland. “GB Day Visitor 2024 report, domestic day visits.” visitbritain.org, 2025-05-08. visitbritain.org. Accessed 2026-10-23. Back to text
- VisitEngland. “GB Tourist 2024 report, domestic overnight trips.” visitbritain.org, 2025-05-29. visitbritain.org. Accessed 2026-10-23. Back to text
- VisitBritain. “Website IPS Latest Regions & Nations Quarterly Data 2019 to 2024.” visitbritain.org, 2026-09-04. visitbritain.org. Accessed 2026-10-23. Back to text
- VisitBritain. “Annual Inbound Update: GB Nations & Regions, 2025 estimates.” visitbritain.org, 2026-10-16. visitbritain.org. Accessed 2026-10-23. Back to text
- VisitBritain. “Website IPS Latest Regions & Nations Quarterly Data 2025.” visitbritain.org, 2026-10-16. visitbritain.org. Accessed 2026-10-23. Back to text
- Association of Leading Visitor Attractions. “Visits made in 2025 to visitor attractions in membership with ALVA.” alva.org.uk, 2026-03. alva.org.uk. Accessed 2026-10-23. Back to text
- Civil Aviation Authority. “UK Airport Data 2025: Annual (Table 10.3 Terminal Passengers 2015-2025; Table 01 Size of UK Airports).” caa.co.uk, 2026-03-23. caa.co.uk. Accessed 2026-10-23. Back to text
- Transport for London. “Public Transport Journeys by Type of Transport.” London Datastore, 2026-08. data.london.gov.uk. Accessed 2026-10-23. Back to text
- Office for National Statistics. “Business Register and Employment Survey: open access, 2024.” nomisweb.co.uk, 2025. nomisweb.co.uk. Accessed 2026-10-23. Back to text
- Bank of England. “Annual average Spot exchange rate, US $ into Sterling (XUAAUSS).” bankofengland.co.uk, 2026. bankofengland.co.uk. Accessed 2026-10-23. Back to text
- VisitBritain. “Regional Spread by Year 2002 - 2024.” visitbritain.org, 2025. visitbritain.org. Accessed 2026-10-23. Back to text
- Greater London Authority. “Number of International Visitors to London.” London Datastore, 2026. data.london.gov.uk. Accessed 2026-10-23. Back to text
- Association of Leading Visitor Attractions. “Visits made in 2024 to visitor attractions in membership with ALVA.” alva.org.uk, 2025-03. alva.org.uk. Accessed 2026-10-23. Back to text
- Office for National Statistics. “UK Business Counts - local units by industry and employment size band, 2026.” nomisweb.co.uk, 2026. nomisweb.co.uk. Accessed 2026-10-23. Back to text
- Euromonitor International. “Euromonitor International unveils world's top 100 city destinations for 2025.” euromonitor.com, 2025-12-05. euromonitor.com. Accessed 2026-10-23. Back to text
- UK Visas and Immigration. “Get an electronic travel authorisation (ETA) to visit the UK.” gov.uk, 2026. gov.uk. Accessed 2026-10-23. Back to text
- Ministry of Housing, Communities and Local Government. “Visitor Levy Consultation: Government Response.” gov.uk, 2026-09-10. assets.publishing.service.gov.uk. Accessed 2026-10-23. Back to text
- Greater London Authority. “MD3467 Establishing the tourist levy project team.” london.gov.uk, 2026-03-18. london.gov.uk. Accessed 2026-10-23. Back to text
- VisitBritain. “2026 inbound tourism forecast.” visitbritain.org, 2026-08-27. visitbritain.org. Accessed 2026-10-23. Back to text
About the author
Licence: CC BY 4.0. Free to reuse the text, charts and data with credit to London Tourist Map and a link to this page.
Every figure on this page links to its source. How we research